Keeping the above developments in mind, it may be reasonable to assume that technology and price will stop being key differentiators for OTAs. All this at a stage when OTAs are still in the growth phase. In 2015, such companies accounted for $246ii billion of travel sales, less than one- fifth of the global travel market. The need for OTAs to design and promote their offers in ways that can be perceived to add value to the trip planning process will become increasingly important in the future. WNS DecisionPoint™ conducted a survey of users of travel platforms in North America (NAM), Western Europe and Asia Pacific (APAC) to understand the customer perception of OTAs, the nuances of the buying behavior of various online customer segments and the preferences of these segments.
To start with, we assumed that OTA customers, who are a part of the following segments, appreciate the value-added role of OTAs in a trip planning process significantly more than others. This is because the following segments naturally gain from the depth and variety of the travel products that OTAs offer on a single platform.
The table below (Exhibit 6) summarizes the response of survey participants across various regional segments and by age groups. They were asked if they felt OTAs added value to the trip planning process or were merely online agents.
On an overall basis, our assumption that OTA customers, who purchase products other than flights and hotels, bundled package users, OTA mobile app users and OTA loyalty members appreciate the value-added role of OTAs in the trip planning process significantly more than the others was proved. Throughout the rest of the paper, it will also be evident how the four segments are interrelated.
Using Bundled Package As A Differentiator
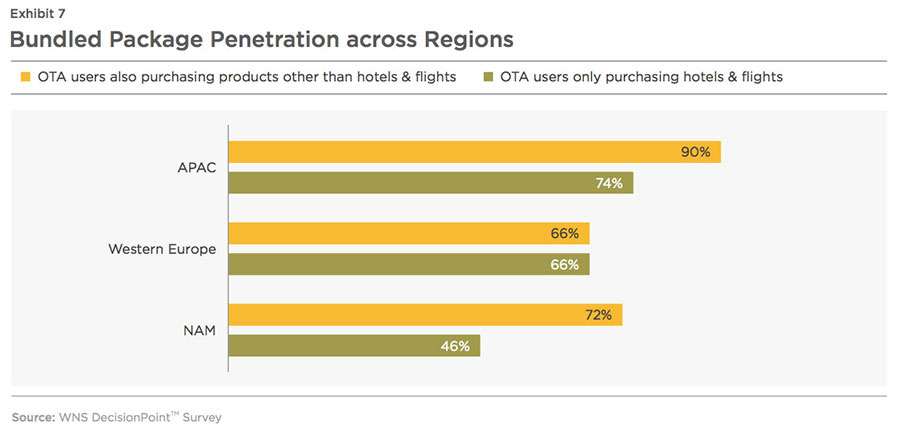
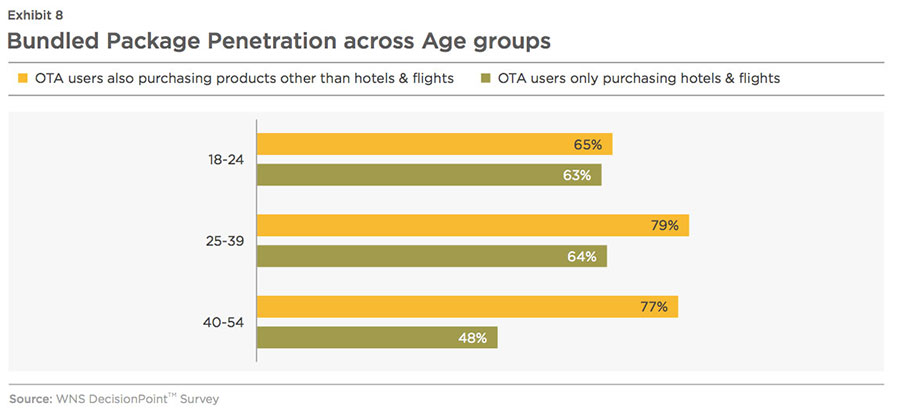
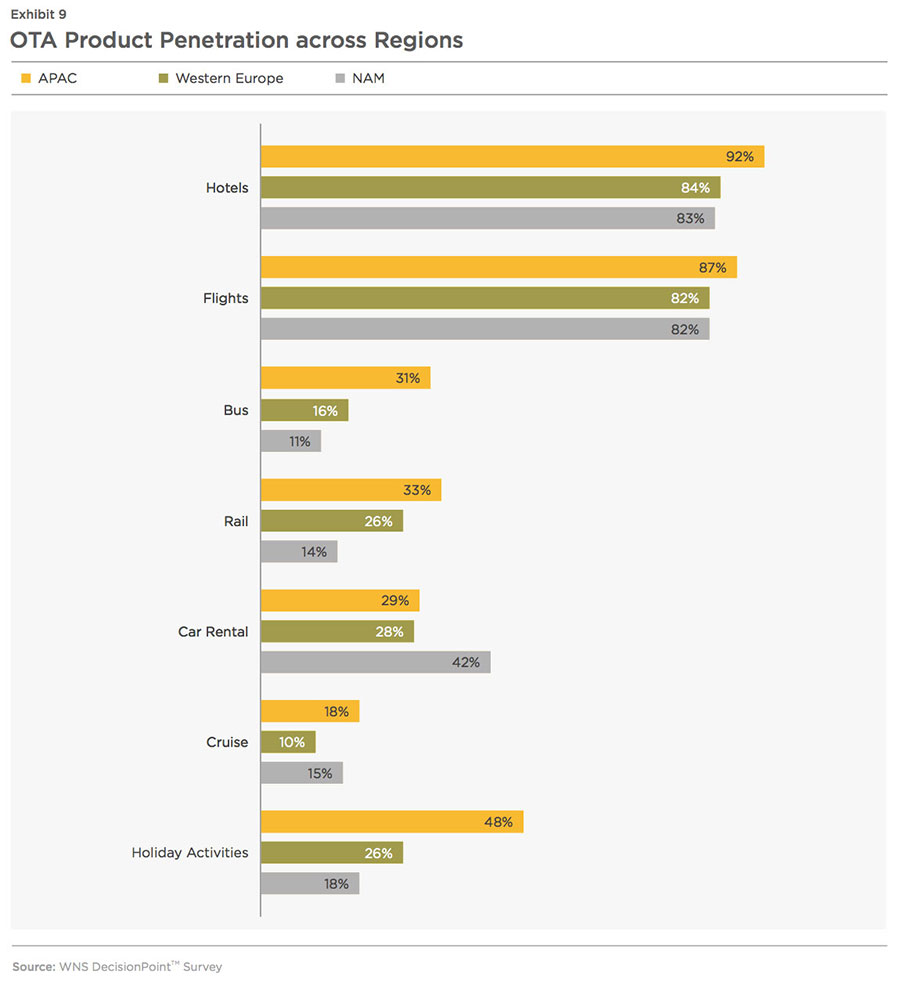
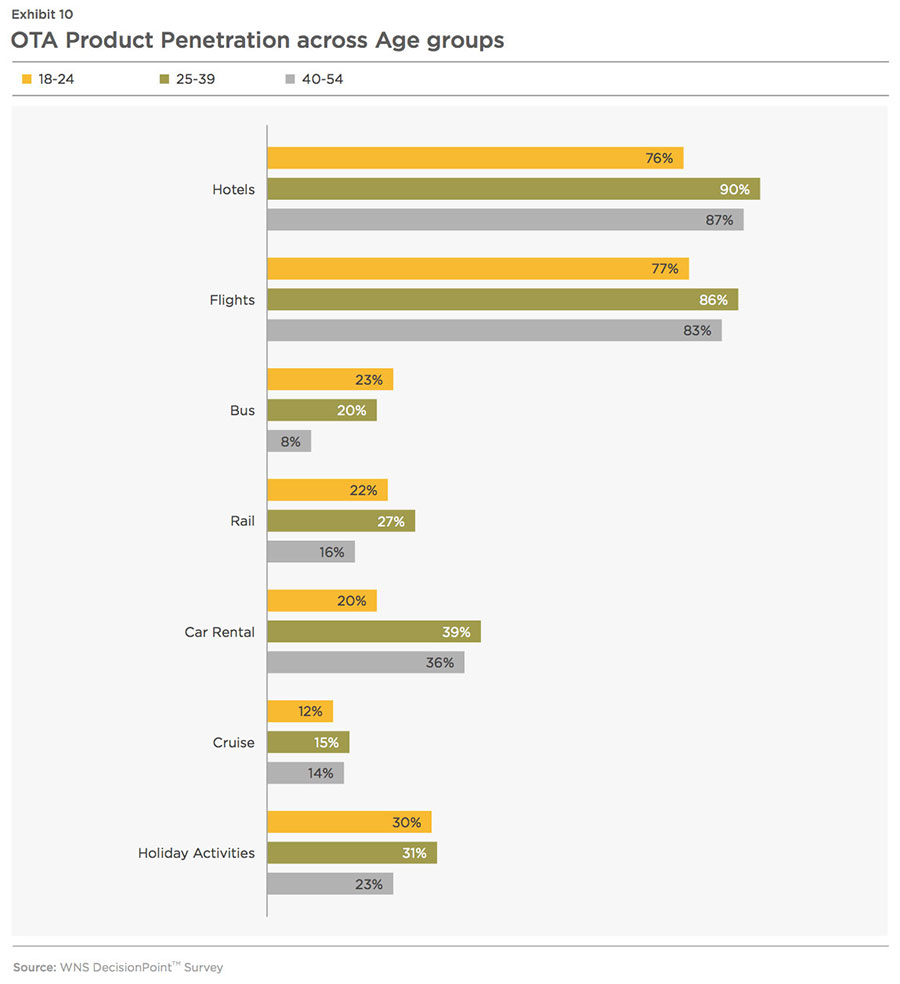
The use of bundled packages is much higher among OTA users, who also book car rentals, holiday activities, and other products besides traditional travel products such as flights and hotels (Exhibit 7 and 8). However, the challenge is that the current product penetration of the various offerings on OTA platforms is low for the non-flight and non-hotel segment compared to the flight and hotel segments (Exhibit 9 and 10). APAC has maximum market penetration for most of the travel product types available on OTA platforms. An overwhelming 90 per cent of APAC respondents purchasing OTA non-flight and non-hotel products use bundled packages.
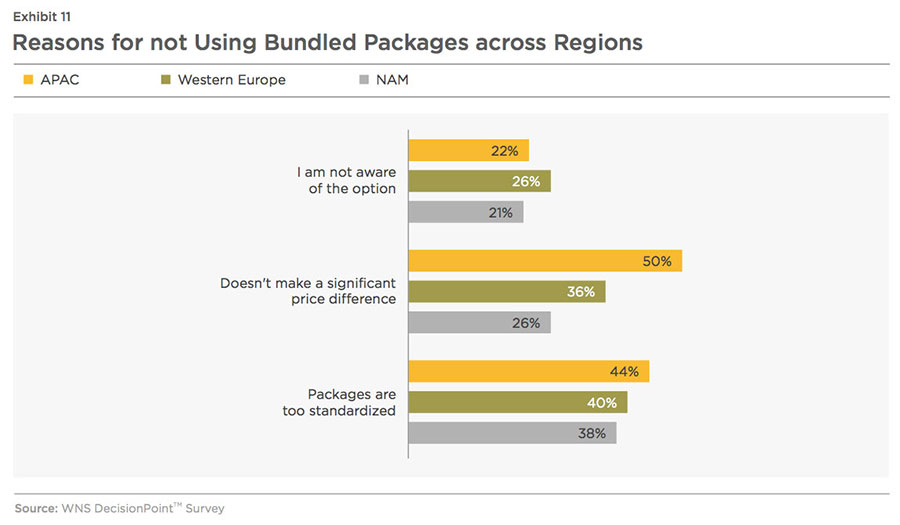
Promoting non-flight and non- hotel products through innovative bundled packages will eventually strengthen the position of OTAs. However, bundled packages, in their current form, need to address some key shortcomings (Exhibit 11 and 12) to increase market penetration. Packages are too standardized came up as the biggest complaint from the non- user group, stressing the need to invest in offer personalization. Including as many travel elements as possible in packages will make packages appear less standardized. On the positive side, an overwhelming 95.5 per cent of the bundled package users said they would use it again, indicating that the problem does not lie as much with the customer experience as with the promotion.
APAC, which has the highest penetration among various OTA products, also shows up as the most price-sensitive market. This calls for special attention to designing products for APAC that add value to customers such as offering quicker redemption options that do not need very high loyalty points.
The popularity of the non-flight and non-hotel products, as well as bundled offers, should logically encourage the use of mobile apps. The greater the number of relevant products, more will be the number of occasions of using the app. Vice versa, greater adoption of apps will allow channels to better promote and popularize the use of non-flight and non-hotel products and bundled packages.
A look into the mobile app usage patterns of different customer segments, who use OTA platforms only for flights and hotels, compared to those who also buy non-flight and non-hotel products, display similar trends (Exhibit 13 and 14). Users of bundled packages also have adopted mobile apps far more than customers, who do not use bundled packages (Exhibit 15 and 16).
It is interesting to note that OTA users purchasing non-flight or non-hotel products acknowledge the value of loyalty programs more, compared to those who only book flights and hotels on OTA platforms.
Among the respondents who saw OTAs as value-adding travel partners, the following were the key reasons driving such a perception (Exhibit 17.)
OTAs currently offer travel packages, but while planning marketing strategies, more focus needs to be given to the promotion of this product segment. Twenty three per cent of OTA users in our survey said they were not aware of the bundled package option.
The OTA industry, through a series of mergers and acquisitions, has witnessed a phase of consolidation. This gives them access to multiple travel products, putting them in the best position to offer bundled options and greater choices to customers.
Designing innovative product combinations at tailored price points and catering to specific audiences will enable OTAs to be better perceived as value-added service providers, rather than just online travel agents, who are easily replaceable.
To enhance the effectiveness of marketing campaigns, segmentation grids can be developed on the basis of structured data such as age, range of income, profession, family type and size, past travel spend, destinations and so on. A couple of examples are given below:
The vertical axis indicates the vacation type preference of the traveler while the horizontal axis represents the travel budget.
In the case of a lower marketing budget, the target segments can be visualized as four types, based on a 2X2 Grid
This strategy highlights the minimum viable customization capability of OTAs. Further personalization can be offered as a premium offering.
The above mentioned bundled segments will need to be promoted through targeted campaigns by segmenting registered users as well as potential travelers.
Using Mobile App As A Differentiator
OTAs already have a distinct advantage over hotels and airlines in the smartphone segment. This is evident from the chart below (Exhibit 20).
A look at the App Quality Index given below also shows that OTA apps, on an average, score much better than those of airlines and hotels.
As discussed in a Credit Suisse Digital Distribution Seminar (November 2014), an average smartphone user has around 26 apps on his/her device but actively uses just 10. The rest are hardly ever used. 29 per cent of apps are downloaded and used only once. WNS DecisionPoint™ survey results also reveal that although 57 per cent of OTA customers have downloaded an OTA mobile app, only 42 per cent use it at least once a year (Exhibit 24). The figures look somewhat encouraging as far as multiple OTA app downloads and frequency of use are concerned (Exhibits 25 and 26).
Monthly usage rate of OTA mobile apps is much higher for those purchasing non-flight and non-hotel products as well.
It was also interesting to note that 59 per cent of OTA users, who had downloaded the app, said they did so to get an app-specific discount or offer (Exhibit 27). However, the top two perceived advantages of OTA apps were getting instant updates and ease of use (Exhibit 28).
Thus, offering discounts do work as a stimulus for initial app download, but for sustained use, customer engagement via instant updates, ease of use and intuitive functionality should play a more critical role.
To promote the use of OTA apps, some existing challenges need to be taken into consideration. WNS DDecisionPoint™ studied ~500 reviews of OTA mobile apps listed on the Google Play website and came across 80 negative responses. The top complaint at 20 per cent was 'Bundle/Package option not available'. This highlights our earlier point that bundling offers effectively will be an essential differentiator for the OTAs.
Another challenge lies in the adoption of mobile as a booking device for travel. This is still far below laptops and desktops. The survey figures exhibit reveal a huge contrast even while comparing browsing vs. booking activity within the mobile user segment.
A look into all the OTA app users' responses on whether they use mobile apps for browsing only or also for completing the booking transaction points towards a need for huge improvement (Exhibit 31)
More than half of OTA app users say that not all features available on desktop websites are present in the apps. Redesigning the apps to create a more comprehensive and robust set of features can enhance the user experience. An indicative set of such user-friendly functionalities and features are given below:
- Bundled packages available on apps
- Choice of accessing travel itineraries offline
- Ease of navigation
- Lite versions of apps
Also, some efforts towards creating awareness of the security aspects of mobile transactions through innovative pop-up messages might help generate confidence among app users and encourage them to go ahead with the full booking procedure.
Given the wider scope of OTA apps usage vs. individual hotel or airline apps, this is a channel where OTAs can have a distinct advantage over hotels and airlines. Further, designing an OTA app so that a traveler can use it as a one-stop travel solution should yield positive results in terms of bookings. Post the consolidation phase, the bigger OTA brands can work on making products of subsidiary brands available as part of a single app. This will not only broaden the coverage and increase the per- person-revenue potential, but also bolster the frequency of app use.
Loyalty Programs
More than half (52 per cent) of OTA loyalty program members recognize the value addition provided by OTAs, compared to just 39 per cent of users who are not a part of any OTA loyalty program. More so, in the context of direct push by hotels, lucrative loyalty programs become a necessity to counter the hotel loyalty programs, which are the major tools aiding the direct booking strategy.
Hotels are established players with a long history in the loyalty landscape when compared to OTAs. Major hotel and airline loyalty programs have existed for the last two to three decades. Most of the OTAs, on the other hand, started their loyalty programs just a few years back. As seen below, they have a long way to go in terms of loyalty program adoption in contrast to hotels and airlines.
The current limitation of OTA loyalty programs is that they mainly offer discounts and encourage price- centric customer behavior. Some are simply tied to credit cards and limited in terms of geographies. However, OTAs have some distinct advantages, which can be used in their favor to nurture their relationships with loyalty members.
Wider product portfolio offers wider redemption options. A quicker redemption cycle is possible, as members can collect and redeem points irrespective of the travel brand. In the case of hotels, travelers need to stick to the same or associated brands to accumulate or redeem points. This is more lucrative for leisure travelers, who form the bulk of the OTA user segment.
OTAs possess an enormous amount of data on the detailed purchasing trends and buying behavior of travelers, spanning travel products such as hotels, flights, car rentals, holiday activities, etc. Application of sophisticated analytics techniques can reveal patterns, which can aid the design of relevant and new loyalty programs that are more evolved than today's cookie-cutter schemes. A lot of ideas can be generated by closely studying hotel and airline loyalty. For example, leading OTA players undergoing a series of mergers and acquisitions can take a page out of Marriott's book by studying the way Starwood Preferred Guest (SPG) and Marriott Rewards were merged post the acquisition of Starwood by Marriott. SPG members can now opt to link their account with Marriott Rewards while retaining their membership tier in both programs. The two programs will operate independently till 2018, after which they will be combined into a new program. As of today, the two programs together have about 85 million members.
Programs can be designed in a manner so as to encourage redemption across the various subsidiaries of major OTAs. This lets the guests explore the wide array of services provided by a plethora of brands. However, while OTAs may have an upper hand in offering more redemption options, hotel loyalty programs have a natural advantage in terms of the experience provided to members. Being travel suppliers themselves, it is more convenient for hotels to offer experience-centric perks such as late check out, complimentary drinks, spa discounts, etc. Making deals with independent hotels (with limited distribution capabilities of their own) to drive up customer loyalty is an option, which can add to the experience aspect of OTA loyalty programs.
It is also wise to keep looking for partnering opportunities such as Expedia recently did. The OTA giant has introduced a provision for displaying discounted loyalty rates next to standard rates and is promoting the hotel's loyalty programs. The first hotel brand to enter in this arrangement is Red Lion Hotels Corporation, operating in the USA and Canada.
Higher adoption of loyalty programs can also work in favor of the frequency of app use and vice versa.
Currently, OTAs seem to be doing better than hotels and airlines in terms of smooth redemption of loyalty points on mobile apps (Exhibit 33). They are also encouraging app use by providing extra loyalty benefits for app users (Exhibit 34).
According to the American Customer Satisfaction Index (ACSI) figures released in 2016 (Exhibit 35), OTAs fare better than hotels and airlines on the loyalty program front.
OTAs seem to have recognized the need for an extra push on loyalty. However, being late entrants, they have a long way to go, judging by market penetration and adoption rate (Exhibit 32).
Conclusion
Customer engagement is a key requirement in an environment where travelers are regularly flooded with emerging alternatives in the travel intermediary space. Bundled packages, mobile apps and loyalty programs can be used as tools to effectively identify and augment the most loyal segment. These interconnected elements can be woven into a strategy to boost customer engagement and secure a distinctive space in the traveler's mind and wallet.
Building customized bundled packages and marketing campaigns through apps, along with working towards higher adoption of loyalty programs, should be the key strategy.
Going by what we saw earlier in Exhibit 6, this strategy will work well in the more mature markets such as Western Europe and North America.
While APAC is an exception, where bundled packages, mobile apps and loyalty programs do not necessarily enhance customer perception of OTAs' role, the user segment from this region is technology-savvy and the most receptive to OTA platforms and products. However, it is also the most price-sensitive market and needs a value-for- money positioning through combo deals and interlinked discounts. For example, offering extra loyalty points for the use of bundled packages and app-specific discounts.
In the long run, as the emerging markets mature, the following differentiation roadmap has the potential to be a successful framework at a global level.
- Build customizable bundled packages
- Promote packages with special focus on mobile apps
- Boost the above steps further through bonus points in loyalty programs
References:
i. Expedia Investor Presentation, March, 2016
ii. Angelo Rossini, Euromonitor, State of Online Travel Agencies: Ctrip Joins Priceline and Expedia as Global Giant, Skift, July, 2016
iii. Dan Peltier, 4 Charts Showing Growth of Online and Mobile Travel Bookings by 2020, Skift, June, 2016
iv. Sarah Miller, It's Not About OTAs vs. Direct Bookings, Hotelogix, March, 2016
v. Kevin May, Direct Now Cheaper than Agencies for Majority of Hotel Searches, Tnooz, August, 2016
vi. Deanna Ting, Hotel CEOs won't Back Down when it Comes to Pushing Direct Bookings, Skift, May, 2016
vii. Priceline Annual Report, 2015
viii. Priceline Annual Report, 2014
ix. Morgan Stanley, Global Insight, Internet, Lodging, Leisured and Hotels, November, 2015
x. Deanna Ting, Airbnb's Impact on Online Travel Agencies and Hotels Is Different than you Thought, Skift, June, 2016
xi. Jason Clampet, Everything you Wanted to Know about the Hotel Industry's Gripes Against OTAs, Skift, April, 2016
xii. Hotel Analyst, The Hotel Distribution Report, 2015
xiii. Kevin May, The State of Online Travel Agency Bookings in Charts, Tnooz, August, 2016
xiv. Ben Gray, The Best and Worst Rated Travel Apps of 2016. Part of the "Roaming Around: The New Travel Industry" Series, Arc, May, 2016