The National Retail Federation (NRF) predicts holiday sales in November and December to increase by 3.6 percent. This excludes automotive, gasoline, and restaurant salesi. Based on data from the U.S. Census Bureau, this implies net retail sales of USD 655.6 Billion (Exhibit 1). As per our analysis, this is significantly higher than the 2.6 percent average growth for the last 10 years, and greater than the 3.4 percent
growth seen since 2009. E-commerce will continue to be a driving force, as non-store sales are expected to grow between 7 and 10 percent. Taking the mid-point of this estimate at 8.5 percent, we see non-store sales growing to USD 118.4 Billion. While the job sector has seen progressive improvement,iiwhat we have observed is that a significant majority of respondents are cautiously optimistic about both the economy in general as
well their personal financial situation. In this scenario, it is imperative for retailers to understand consumer behaviors and purchase patterns during the vital holiday season.
The WNS DecisionPoint™ Holiday Report is designed to assist retailers as they gear themselves up for this annual extravaganza which is a 'make' or 'break' time for many of them.
As seen in Exhibit 2, 53 percent of respondents believe the economy is still recovering from recession. This cautiousness springs from consumers' expectations regarding their income prospects in the coming months, as 62 percent of respondents think their financial situation is either the same or worse than last year. This short- term cautiousness is explained by the fact that improvement in employment opportunities has been nullified by rising inflation and near flat wage rate. Hence, personal disposable income growth year-on-year has remained more or less stagnant. The Consumer Confidence Index for October indicates consumer sentiment at its lowest ebb in 13 months (Exhibit 3). And while these macroeconomic factors have been omnipresent, retailers this year have been presented with the additional challenge in the form of 2016 presidential election. Approximately 43 percent of respondents are being more cautious in their spending outlook due to the political uncertainty of the election season, as per a flash poll conducted by NRF in mid- Octoberiii.
Our survey findings validate this sense of apprehension. Only 14 percent of respondents in the survey mentioned that they will spend more in this holiday season as compared to last season. 62 percent of respondents expect their spending to be the same as that in last holiday season.
A significantly large proportion of lower income groups (<$30,000 and $30,000-$49,999) are planning to spend less (Exhibit 4), while approximately two-thirds of the respondents in the higher income groups plan to restrict their spending levels to the same as last year.
Since a large number of consumers are facing a dilemma regarding their spending, it is important for retailers to identify consumer preferences and choices. Doing so will allow them to align themselves with customer expectations and generate incremental spending from undecided consumers.
Category, Channel Preferences, And Device Usage
Category and Channel Preferences
Overall, consumers plan to spend on an average USD 998 on holiday shopping this year (Exhibit 5). Gifts continue to be a major category of spending (53 percent), followed by experiential spending as consumers look to socialize away from home (15 percent). Consumers continue to seek personalization in gifts, as gift cards remain the most popular category sought by 61 percent of respondents, according to an NRF surveyiv. This is followed by clothing and accessories (54 percent), and books, CDs, DVDs (40 percent). Books, CDs, DVDs as a preferred category are at their lowest level ever as the substitution effect of digital downloads becomes more prominent.
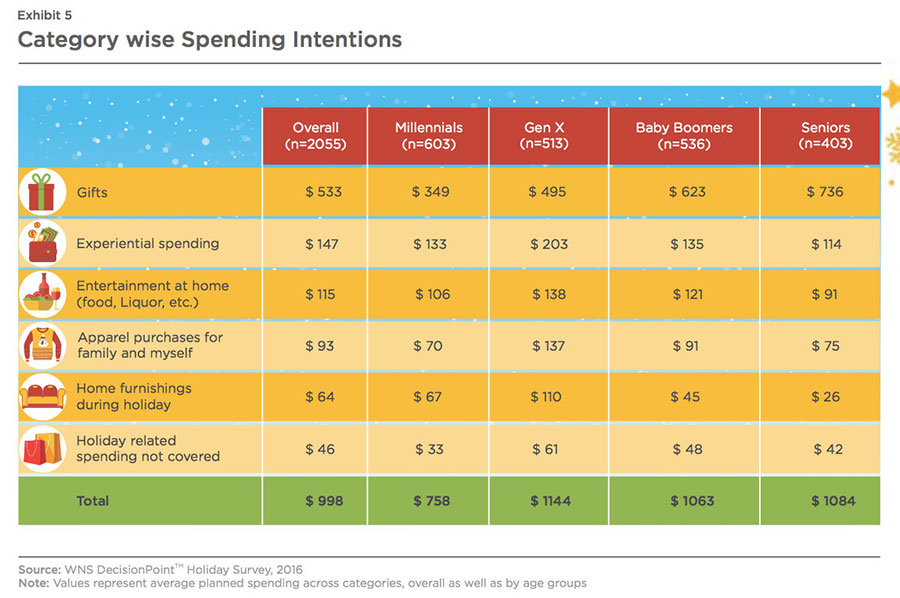
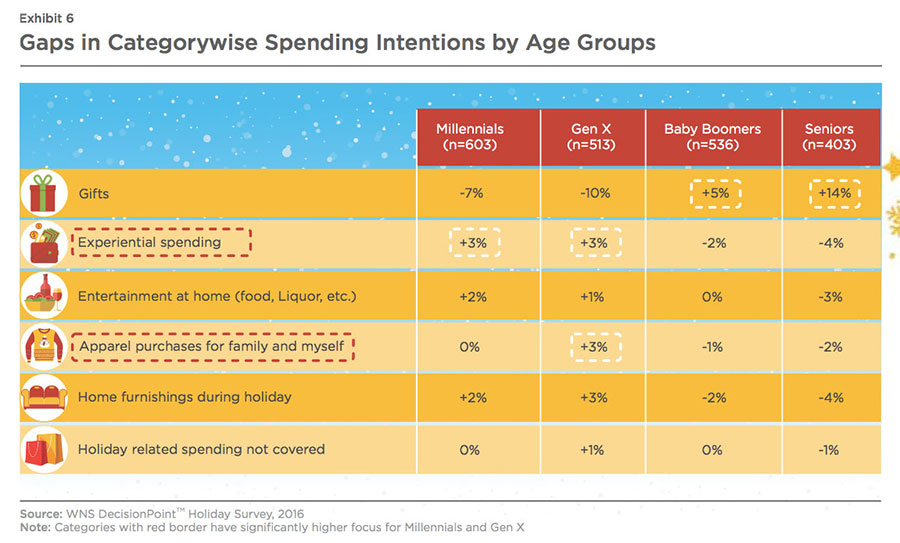
Our analysis reveals that spending varies across age groups. Millennials are planning to spend the least (USD 758), as ballooning student loans and appreciation in housing prices have affected their discretionary spendingv. At the other end of the continuum, Gen X are planning to spend the highest amount at USD 1144. To better identify generation specific traits, we have calculated spending gaps in these categories across generations. Millennials and Gen X both tend to spend less on gifts, as seen in Exhibit 6. Instead, they propose to allocate a significantly higher proportion of their holiday budget on experiential spending in the form of travel, hotel bookings, and eating out. Additionally, Gen X will likely spend more on apparel purchases for themselves and their families compared to other generations. The two older generations (Baby Boomers and Seniors) are planning to spend a much higher proportion on gifts. Specifically, our analysis reveals that Seniors are planning to spend an additional 14 percent on traditional gifts, even if it means compromising their spending in other areas. While their average planned spending is USD 326 more than that of Millennials, allocation for experiential spending, entertainment at home, and home furnishings is less.
Although in-store sales will continue to be the largest channel, our findings suggest that Americans plan to allocate 43 percent of their spend to digital shopping. This highlights the rapid adoption of digital channels, even as physical channels make up 57 percent of intended spending (49 percent in-store, 8 percent in other formats such as craft fairs, strip malls). Millennials are the most digital savvy generation and allocate more than half of their intended holiday spending
(53 percent) to digital channels regular shopper with Macy's stores will most likely stick to macys.com while shopping onlinevi. Our analysis also reveals some very expected results, i.e., Seniors report lowest levels of online adoption. Only 28 percent of planned spending is assigned to digital channels, indicating a high degree of apprehension regarding e-commerce.
Device Usage
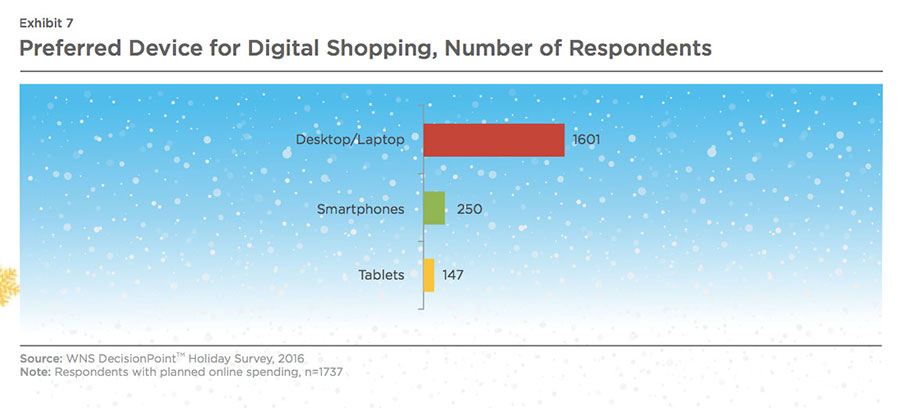
Given the importance of digital channels, it is imperative for retailers to take a closer look at usage patterns of devices. Our survey findings highlight that 84.5 percent (n=1737) of respondents have assigned some part of their planned spending to digital channels. Amongst them, we find that desktops/laptops are the most preferred devices for online shopping, followed by smartphones and tablets (Exhibit 7). Tablets lost their position of pre-eminence as smartphone screen sizes became larger allowing shoppers to navigate easily on their mobile devicesvii.
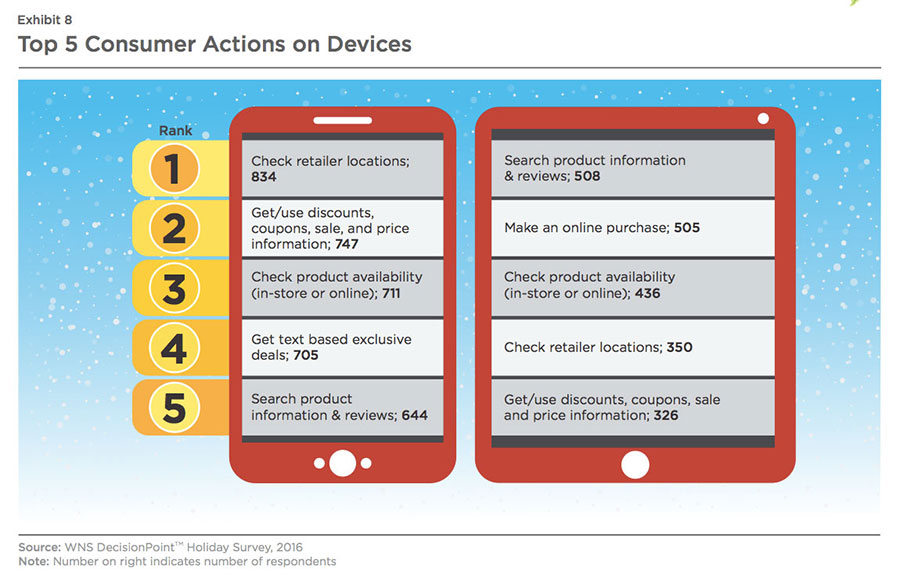
This implies that retailers need to provide a seamless omni-channel experience to consumers who use mobile apps as evidenced by 70 percent increase in app driven commerce in 2015viii. Retailers failing to do so will be unable to capitalize on a high growth channel and risk being left behind. To capitalize on this broader trend, retailers need to first identify behavioral preferences of consumers and map their digital strategy accordingly. Crucially, retailers need to differentiate usage patterns for smartphones and tablets. While consumers tend to use tablets for more detailed and
tedious tasks primarily because of the large screen size, smartphones are used for more simple and transient activities. This is true for both digital and in-store touchpoints. Smartphone use is skewed towards looking for product information and availability, identifying specific locations of a retailer, and receiving discount offers and deals (Exhibit 8). Consumers are relying on smartphones as an important research tool that aids in the buying decision rather than for making online purchasesix.
An important aspect is the relationship between the nature of purchase and device used.
Desktops/laptops are used for making planned purchases, while mobile devices (smartphones and
tablets) are preferred for unplanned purchases.
Drivers of In-store Device Usage
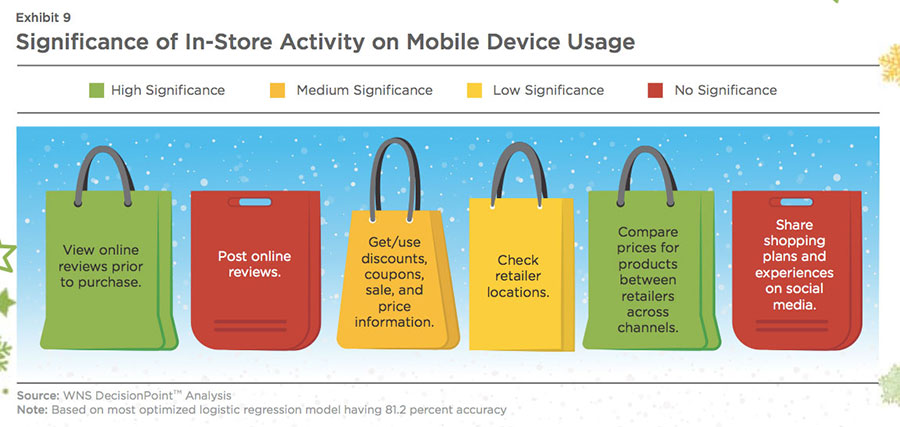
The scope for the use of mobiles as an in-store engagement tool is high. Consumers visiting a store may have decided to make a purchase, or may be very close to making one. An interactive app will enhance their in-store experience and ensure higher conversion. Retailers thus need to identify the most influential patterns that shape the decisions of shoppers who frequently use smartphones in- store. WNS DecisionPoint™ used a logistic regression modeling technique to identify the following patterns as the most significant.
- View online reviews prior to purchase
- Post online reviews
- Get / use discounts, coupons, sale and price information.
- Check retailer locations
- Compare prices for products between retailers across channels
- Share shopping plans and experiences on social media
As self-service becomes the new norm, shoppers are comparing prices, reading reviews and searching for promotions in-store through their digital devices (Exhibit 9). This can be understood in the context of the immediate store environment for a holiday shopper. Consumers are more likely to go home and then share reviews using a desktop/laptop, while in- store, they tend to mostly view reviews.
Mobility will be an integral part of digital strategy for retailers, even if consumers don't make an online purchase on their smartphones. Consumers are treating their smartphones as virtual shopping assistants, with ~53 percent of them ascribing their holiday spending to prior research. In a world of mobile-optimized and responsive websites, apps help customers find their nearest stores, check inventory, navigate in-store and scan barcodes for extended product information and customer reviews. Hence, it is not surprising to find that app shoppers, on an average, spend more than mobile website usersx. This has major implications for retailers' direct marketing push through mailers. The marketing mailer can invite customers to download the app and provide feedback. At present, a majority of mailers provide links to retailers' websites and fail to capitalize on the opportunity for higher engagement and spend levels.
Viewing online reviews and price comparison drives in-store use of smartphones for consumers.
Shopper Cadence
Recent holiday seasons have witnessed a reduction in importance of Black Friday sales. A variety of factors are responsible for this - primarily ease and wider adoption of online shopping combined with early discounts by retailers. The presence of deals on e-commerce sites such as Amazon throughout the holiday season implies that consumers are spreading out their expenses over two months, with Cyber Monday rapidly closing in on Black Friday sales numbersxi.
We have gauged the shopping patterns of consumers, specifically their timeline for shopping from start to finish. We broke down the timeline into three phases - beginning, completion of more than half and final purchase. Our analysis reveals that the majority of shoppers (~60 percent) will begin their purchase before Thanksgiving, and nearly a third will prefer the week of November, just before Thanksgiving. Hence, we have developed decision plots based on subsequent timeline for completion of "Majority of Purchase" (50%) and "Final Purchase"
(Exhibit 10).
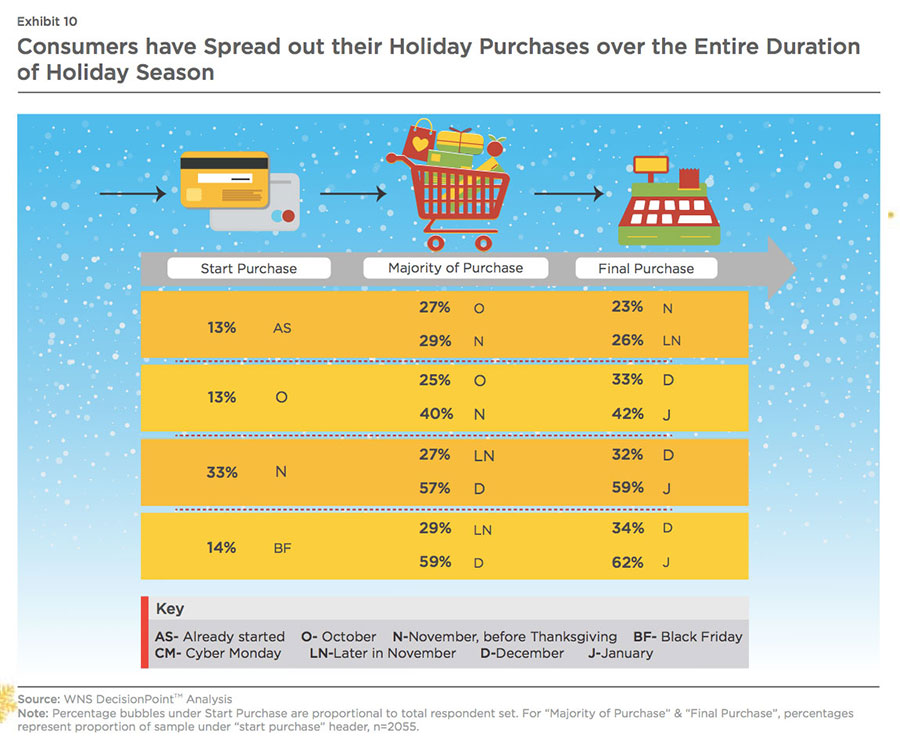
In our analysis, we have included shoppers who begin their holiday shopping till Black Friday, and accounting for 72.5 percent of respondents. Most of the shoppers will complete the majority of their purchases by November or December, if they begin their purchase in October or early November. Specifically, one-third indicated that they will begin their holiday shopping in early November. Of this set, 84 percent of respondents will complete most of their shopping by late November or early December. However, we see a majority of people waiting till December or even January to finally conclude their holiday purchases as they hold on to their dollars and wait for deals.
This holiday season will have a slightly different pattern, driven by
elections in early November and Christmas falling on a Sunday.
As indicated previously, consumers have deferred their shopping due to impending elections, while a Saturday Christmas eve may lead to an exponential jump in last minute shoppers. Weak sales performance through Thanksgiving may lead to a flurry of promotional activities, as retailers will attempt to clear their inventories.
Format Preference
According to our survey, while consumers are likely to visit on an average five formats across in-store and online channels, they are more prone to restrict their choices in an online scenario. Our findings
highlight that respondents, on an average, shop at three in-store formats during the holiday season, compared to only two online formats. Based on consumer preference for formats and activity
by channels, we have identified a few outcomes which have a high probability of coming true this holiday season.
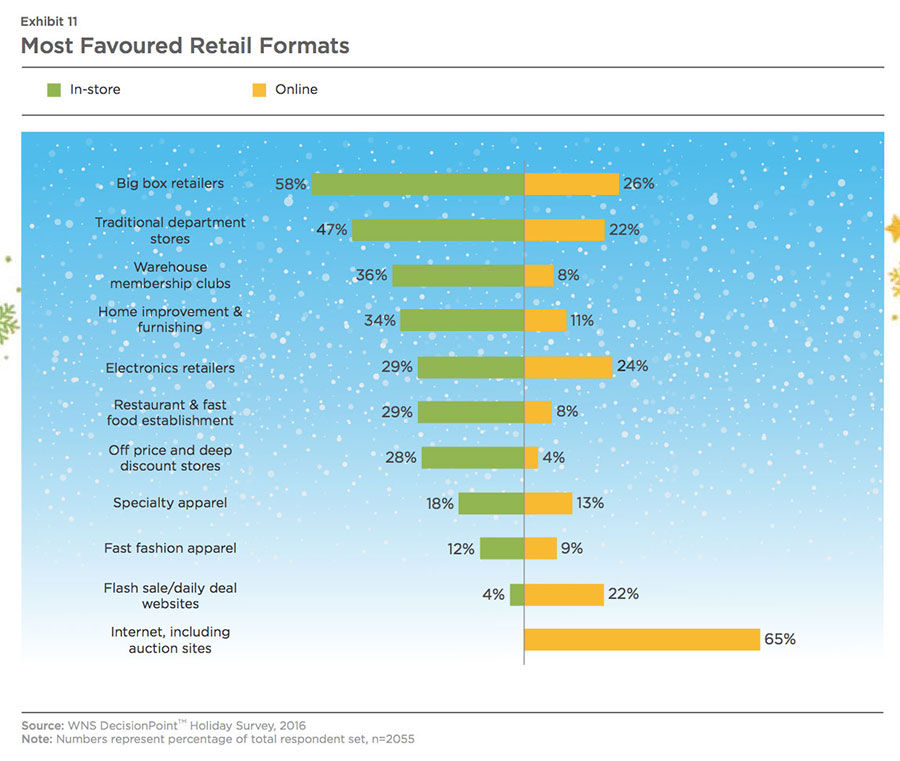
E-commerce will excel. Our survey findings illustrate that e-commerce players, driven by Amazon, will have a record setting holiday season. While omni-channel retailers have made efforts to provide consumers with a seamless experience across channels, our survey indicates pureplay e-commerce websites to be the overwhelmingly preferred format for online shopping. Nearly two- thirds of respondents in our survey prefer them for online shopping, with big-box retailers such as Walmart and Target being a distant second at 26 percent (Exhibit 11). Various sources suggest online holiday sales will grow to more than USD 90 Billion in net sales, as both Cyber Monday and Black Friday sales will cross the USD 3 Billion markxii. As highlighted earlier, mobile sales will be a key enabler of this phenomenon. Retailers who have previously struggled with mobile strategy amid rising competition from other Internet giants would be well served to align their digital investments accordingly.
BOPUS omnipresent, stores are not dead. At WNS DecisionPoint™, we identified consumers channel preferences along the purchase decision journey (Exhibit 12). Our analysis reveals that consumers still prefer stores as point of purchase, even though the gap with online channels has become insignificant. However, more than a third of respondents (36.6 percent) indicated that while they may make the purchase online, their preferred point of collection is the storefront. This indicates a wide degree of acceptance for Buy Online Pick Up In-store (BOPUS) as consumers look for a higher degree of convenience. This convenience is driven by the need for expedited delivery, as consumers want to use their purchases quickly. Research also suggests that a large portion of consumers want free shipping, which is becoming more and more difficult due to rise in delivery costs. To support these trends, companies need an integrated inventory, order processing, and fulfilment solution where consumers can purchase online and pick up in-store. Thus, 'click and collect' strategy can protect retailers' margins from the "huge" cost of online orders by eliminating "the last mile to someone", which is the most expensive part of delivering. Also, retailers can bring the online consumer to the storefront, providing themselves with an opportunity to cross-sell.
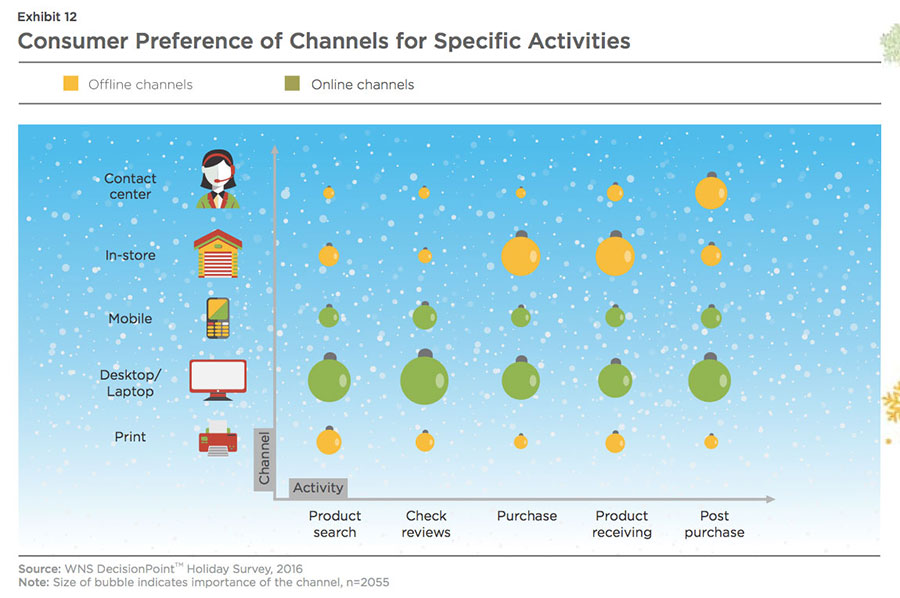
Contact centers and online, both important for aftersales service. As seen in Exhibit 12, both contact centers and online channels are important with respect to aftersales service. Perceived service value is a fundamental predictor of customer satisfaction, brand loyalty and financial performance. Retailers still have major issues in integrating data from multiple channels on a real- time basisxiii. Periodic exercises of collating data from multiple channels leads to lower efficiency and is at best a temporary solution. Instead, retailers would be well served to deploy integration servers to collate data from multiple sources. End-users can tap into this integrated information layer through a user interface and address customer issues. Retailers taking this approach are poised to improve their service quality, as contact center personnel are equipped with real-time information on customer issues and queries.
The ever-present influence of online. Online channels are ubiquitous across the decision- making journey of the consumer. Our analysis reveals that the majority of product research prior to purchase happens in the online channel and this trend is growing. For every one consumer, preferring print media for product search, nearly four individuals look up online as they begin their purchase process. This has created an immediate need for product information on-the-go. The implications are clear for retailers: they need to ensure that their consumers have the right information at their fingertips, anytime, anywhere. Even for marketers, ensuring that their message is personalized, contextual and timely has never been more important.
Webrooming trumps showrooming. What is reassuring for brick-and-mortar retailers is that more consumers will treat the store as the final point of purchase after doing research online. Consumers have indicated a higher propensity of 'webrooming' - i.e., looking at products online, but purchasing them in a physical store. While only 56 percent of respondents have indicated they will 'showroom' or look for products in a physical store and eventually make the purchase online, 74 percent of respondents have indicated a propensity to webroom.
Nearly one third of the consumers who purchase online, prefer going to stores to collect their items.
In-Store Shopping
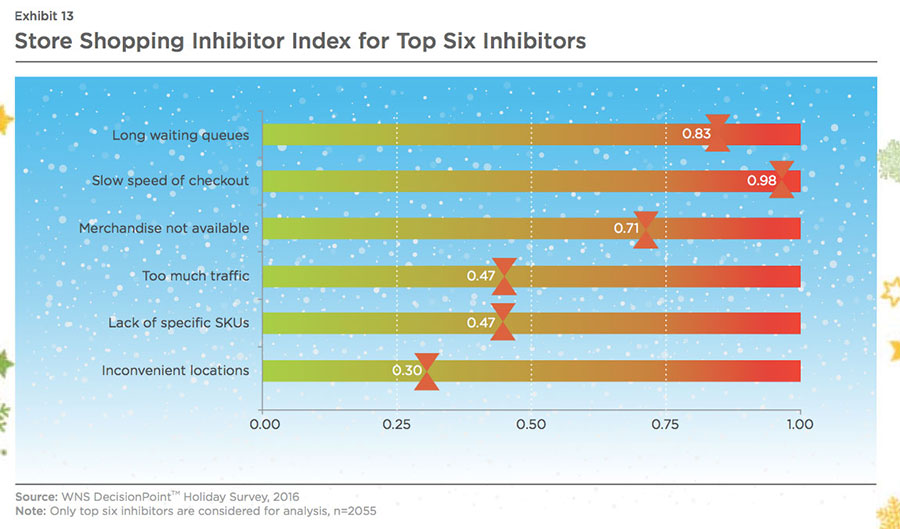
To measure the degree of influence of an inhibitor on a customer, which discourages him/her from shopping in-store this holiday season, WNS DecisionPoint™ has developed a Shopping Inhibitor Index. Our index looks at the relative importance of these inhibitors in conjunction with the proportion of the customer base considering an inhibitor to be a major deterrent for in-store shopping. The top three in-store shopping inhibitors are and unavailability of the desired merchandise (Exhibit 13). We have identified a few broad themes which form an integral part of a retailer's journey to deliver a seamless in-store experience.
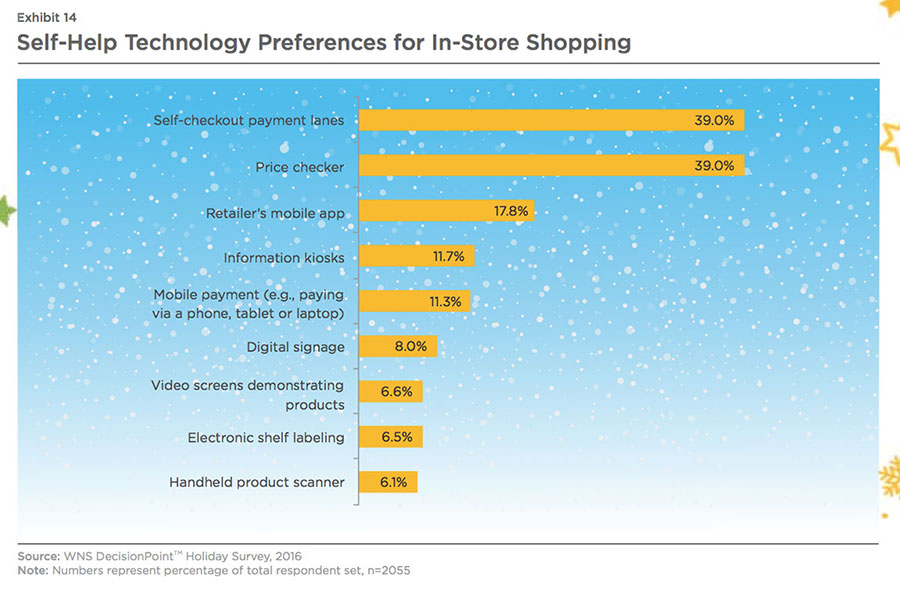
Price checkers, self service kiosks gain greater adoption.
Consumers expect a plethora of self-help initiatives from retailers to resolve bottlenecks associated with in- store shopping. When asked about self-help technologies they will use for their in-store holiday shopping, price checkers (39 percent) and self-checkout payment lanes (39 percent) were most preferred (Exhibit 14). While price checkers allow customers to scan prices across multiple discount offers, they also enable retailers to collect data and refine their pricing strategy at a Stock Keeping Unit (SKU) level and on a dynamic basis. Similarly, self-service payment lanes speed up the checkout process, improve productivity of store associates, and boost convenience for the shopper. Amazon has already taken a step in this direction, by piloting with the Amazon Go store. As consumers enter the store, they scan their phones at the entrance activating the Amazon Go app which tracks the specific SKUs customers pick. The picked items are added to a virtual cart on a real-time basis and customers are charged on their Amazon account as they exit the store.
Endless aisles.
An extension of the self-service concept, consumers can use in-store kiosks to order products not available in a store and the product can then be shipped to the designated address. Endless aisles allow retailers to provide more viable alternatives to their customers, enhancing satisfaction levels and driving incremental sales. Retailers can configure kiosks inside stores to function as a shopping assistant for customers and also provide an option for self-service checkoutxiv.
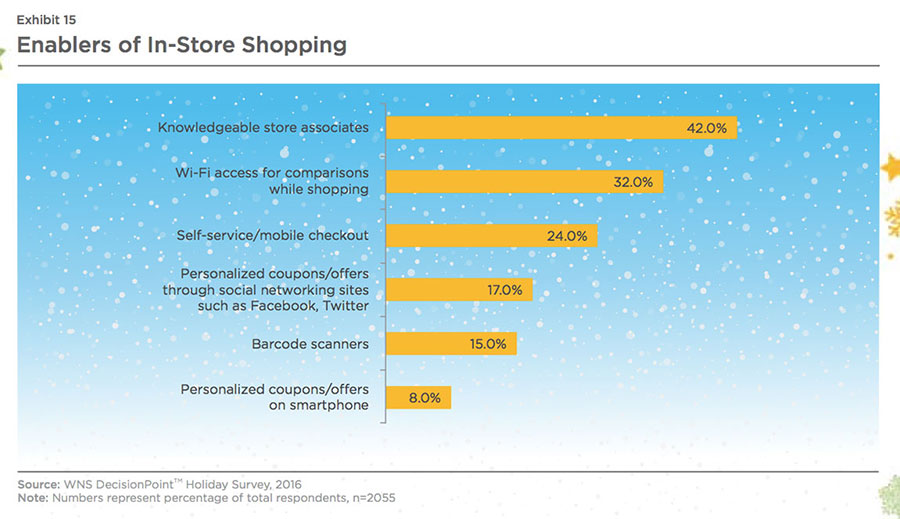
The importance can be understood by the fact that respondents consider self-service kiosks as the third most important driver (24
percent) for completion of an in- store purchase (Exhibit 15).
Knowledgeable store associates help, as in-store Wi-Fi is now table stakes.
While retailers make technological advancements to assist the shopper in-store, sales associates continue to be a key factor in storefront conversion (Exhibit 15). Recent research by Wharton professors suggests that sales associates who undergo short online training courses drive 69 percent higher sales than associates who don'txv. This increase is linked incrementally to the level of training, as sales increased by 123 percent for associates who took six or more courses. Thus, knowledgeable and considerate store associates are more likely to build a higher degree of consumer loyalty, as they can make effective product recommendations and address queries.
However, shoppers do not want to leave all decisions in the hands of store associates. They will look up for information on their mobile devices for prices and user reviews while they shop in-store. Our analysis reveals that 32 percent
consumers will use in-store Wi-Fi to compare and contrast products and prices. Thus, what was once a point of differentiation for retailers has now evolved to becoming table stakes.
Consumers rate knowledgeable store associates (42%) and Wi-Fi access (32%) as the most important enablers of in-store shopping.
Implications For Extended Ecosystem: Logistics Partners
The rise of omni-channel retail has implications not only for retailers but for the extended ecosystem consisting of logistics partners. Consumers assign the highest importance to free shipping (78 percent) and free returns (58 percent) towards creating an enjoyable online shopping experience. Hence, retailers and their logistics partners have to be prepared for this holiday season and be mindful of the specific trends that are emerging.
Consumers prefer free shipping to fast shipping.
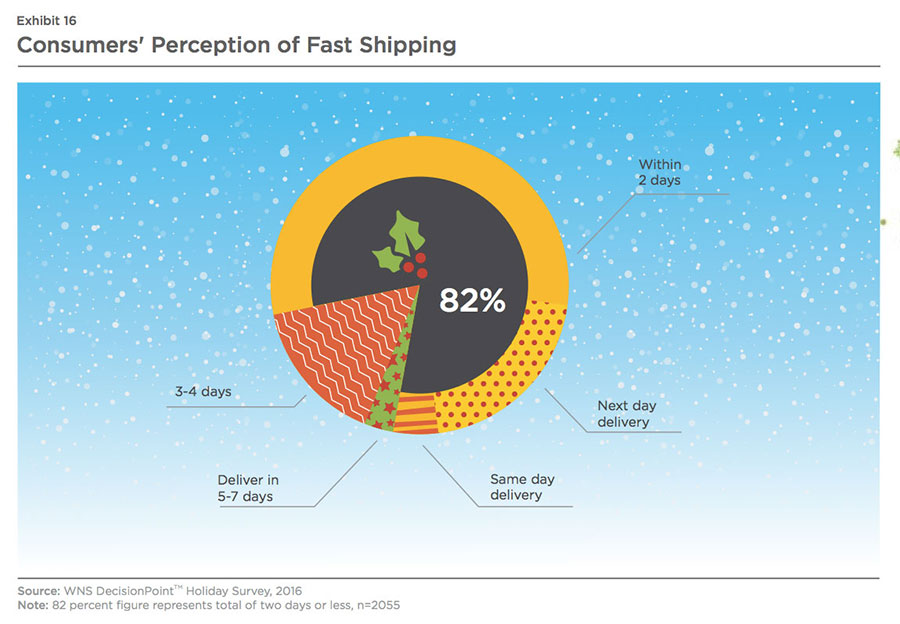
An overwhelming 93 percent of respondents indicated they prefer free shipping to faster shipping, which is paid. Shoppers are using a variety of tactics such as adding additional items to their cart to cross minimum order value eligible for free shipping. Additionally, a significant proportion of them regard free shipping as qualifying criteria before starting their purchasexvi. And if retailers want to make shipping chargeable, they will be well served to deliver within two days. Else, they risk high levels of customer dissatisfaction due to expectation mismatch, as 82 percent of respondents in our survey construe fast shipping to mean delivery in two days or less (Exhibit 16).
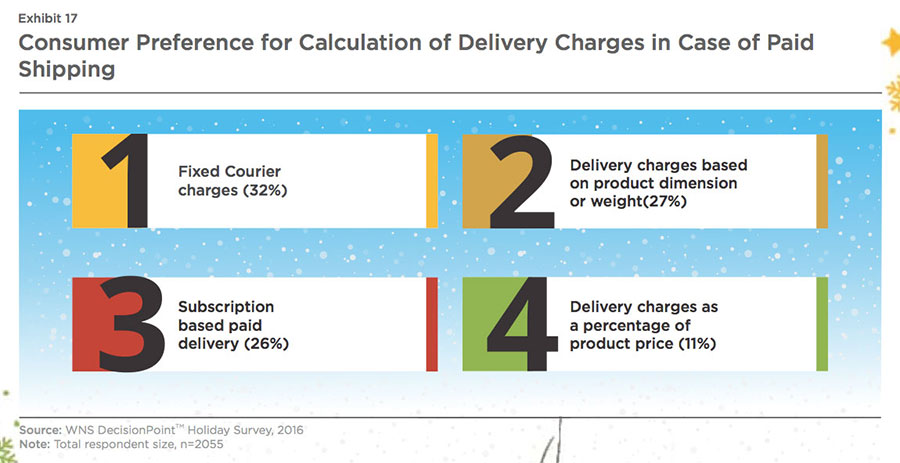
Subscription-based paid shipping gains traction.
Assuming consumers are willing to pay for shipping, we asked how they would prefer the delivery charges to be calculated. In this regard, fixed charges were indicated as the most preferred choice by 32 percent (Exhibit 17), which, however, may not be viable for retailers from a cost perspective. UPS and FedEx, two major shipping partners for retailers, will increase their ground shipping rates by 4.9 percent following a similar increase last year. Additionally, they have reduced the dimension cut-off for additional handling charges. For example, UPS has reduced the cut-off from 60 inches to 48 inches, as it makes additional investment to keep up in a rapidly proliferating omni-channel retail environmentxvii. As companies seek to win customers with competitive but profitable delivery options, subscription-based paid delivery is becoming mainstream as indicated by 26 percent of respondents. Recent research shows that 20 percent Americans have subscribed to Amazon Prime, signaling the popularity of the subscription-based modelxviii. An additional factor driving this widespread adoption is the lock-in effect on customers, as they have to pay an annual subscription fee.
Increased e-commerce, increasing returns.
Product returns are much higher with e-commerce as shoppers are unable to touch, feel or try a particular product prior to buying. Additionally, a competitive e-commerce market means retailers have to keep return policies lenient in order to boost sales. Given the growth in e-commerce, we see product returns growing further this year. Retailers who can strike a balance between providing convenience to customers and minimizing returns fraud will gain most in the long run.
Differences That Matter: Heterogeneity Of Behavioral
Triggers
To tap into the thought process of a holiday shopper,
WNS DecisionPoint™ analyzed the role of specific triggers in consumer shopping. Of 19 initial triggers, we distilled the list down to 10 based on their importance. We found that the degree of importance assigned to these triggers varies across shoppers based on their generational mix, income levels, behavioral traits and spending patterns. We thus classified the respondent set using
statistical analysis techniques into five different segments, as seen in Exhibit 18. We also assigned specific archetypes for each of these segments based on their distinguishing features.
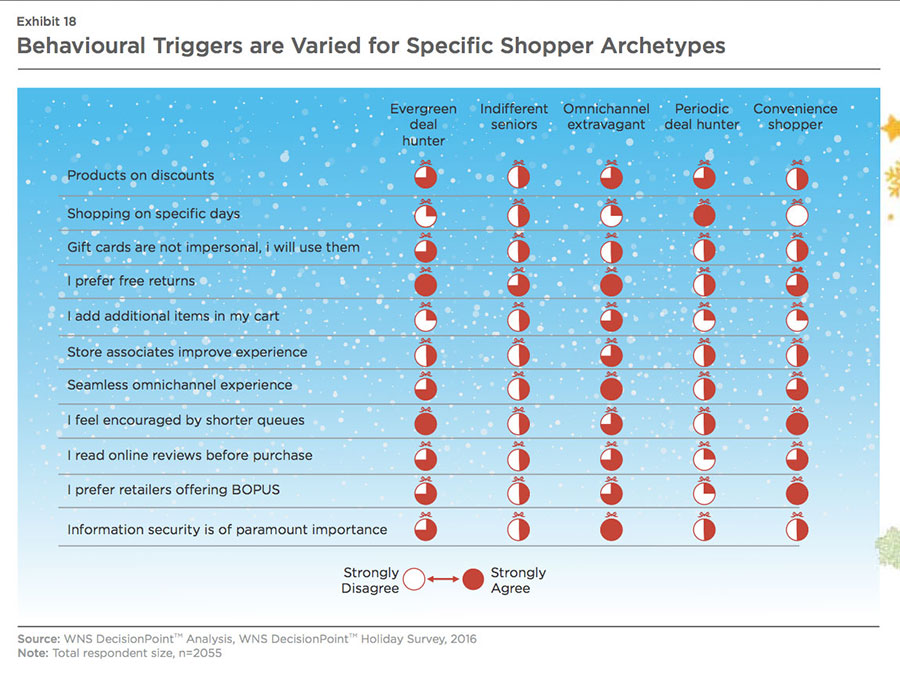
Evergreen deal hunters
consist primarily of younger millennials and Gen X, constituting 72 percent of this cohort. While they consider availability of discounts and free returns as qualifying criteria for purchase, their shopping is not restricted to specific days. This implies a higher proportion of spending to be directed through digital channels (~47 percent) compared to the overall average of 43 percent. This behavioral trait can be put down to their tendency to capitalize on online deals that are present throughout the holiday season and to avoid long queues at storefronts. In addition, they make it a point to read online reviews on their desktops/laptops before making a purchase.
Indifferent seniors
consist primarily of older Baby Boomers and Seniors (64 percent). While preference for free returns is the most important parameter for them, they exhibit a high degree of indifference to almost all other behavioral triggers. And, though their average planned holiday spending of USD 881 is not the lowest, it is more driven by a high degree of indifference to deals and discounts. As a result, they end up paying higher price for products. Our analysis reveals
~60 percent of respondents in this archetype are in the income bracket of less than $30,000 to $74,999. This can be attributed to the fact that a majority of them are retired people whose income levels have declined.
Omni-channel extravagants
consist mainly of older Millennials and Gen X (71 percent). This segment is the most demanding and is seeing a phenomenal rise in their earning capacity coupled with a high propensity to spend. This is indicated by the fact that their average planned spending for the holiday season is a whopping USD 1525, at least 60 percent higher than that of other cohorts. For an omni-channel extravagant, seamless experience across channels is an absolute must, as they interact with a particular retailer using a variety of devices and touchpoints. Their high propensity to webroom (92 percent) and showroom (82 percent) indicates their demanding nature. However, more than half of their planned spending is allocated to online channels (54.8 percent). Given this skew toward online shopping and multiple touchpoints, provision of free returns and information security is of high importance as well. It is to be noted that this segment also assigns a fairly high degree of importance to all other triggers except use of gift cards and shopping on specific days. Retailers who provide the best experience across channels and perform fairly well on comprehensive aspects of their service are the most equipped to gain a fair wallet share of this premium segment.
An omni-channel extravagant consumer, who is willing to spend ~USD 600 more, expects and demands a seamless experience across channels and touchpoints.
Periodic deal hunters
are similar to evergreen deal hunters, and emphasize on the role of discounts as a trigger for purchase. However, shopping is focused around specific days such as Black Friday, Cyber Monday, and Christmas week. Another point of difference is in the relative degree of significance assigned to other behavioral triggers. While evergreen deal hunters assign importance to a variety of behavioral triggers as seen in Exhibit 18, periodic deal hunters are more or less unconcerned about other behavioral triggers. This indicates a high degree of focus on economy shopping, and consequently average cart value is the lowest amongst all segments (USD 850). To obtain the lowest deals, they are willing to spend hours in queues, since majority of their holiday shopping will take place in stores (52 percent).
Convenience shoppers
expect convenience while shopping in- store as well as online. Buy Online Pick Up In-store (BOPUS) is the most important behavioral trigger for this cohort, as is shorter queues at the store front. Average planned spending is USD 914 and they do not mind spending outside conventional channels. This is indicated by an average 12 percent spending in channels such as mail order catalogues and subscription- based home delivery retailers. The remainder spending is equally shared between in-store and online channels (44 percent each). If retailers wish to capture a share of this wallet, it will serve them well to include free returns and provide a seamless omni-channel experience given the convenience-oriented mindset of this segment.
Conclusion
Retailers should benefit this holiday season by considering the implications of our survey findings. As shown by the various cohorts (Exhibit 18), retailers need to align their offerings with consumer expectations. Given the rapid growth in e-commerce in general, and mobility in particular, the blending of physical and digital channels will be even more pronounced. As a result, operationally, retailers will be even more challenged as consumer expectations evolve. An example of this can be seen in differentiators such as in-store Wi-Fi, free returns, and BOPUS becoming table stakes. Similarly, nascent areas such as one-hour delivery and augmented reality will soon become mainstream due to cutting-edge technology innovations, for example, Internet of Things (IoT) becoming commonplace.
Consumers are adapting rapidly to changing technology. The only way for retailers to stay relevant is to have their fingers firmly on the consumers' pulse and be proactive in offering them a truly delightful shopping experience.
References:
i. National Retail Federation (NRF) forecasts holiday sales to increase 3.6%, NRF, October, 2016.
ii. Based on National Employment Database, Bureau of Labor Statistics, Extracted November, 2016.
iii. Report - Holiday shoppers waiting until post- election, Chair Store Age, October, 2016.
iv. INRF Holiday Spending Survey, NRF, October, 2016.
v. Fitch - student loans, stagnant wages push millennials off housing's wealth ladder, Fitch Ratings, November, 2016.
vi. Boomers vs. Millennials - holiday shopping, PYMNTS, September, 2016.
vii. Smartphone shopping comes of age with 20% fully shopping via a mobile device and 60% willing to, says study, Internet Retailing, October, 2016.
viii. Why do consumers like retail apps? Retail Wire, October, 2016.
ix. The 2016 U.S. Mobile App Report, ComScore, September, 2016.
x. Retail email misses the mark when not optimized for mobile apps and web, Internet Retailer, September, 2016.
xi. Is Black Friday doomed to extinction?, Retail Wire, October, 2016.
xii. Online sales will surpass $1 billion nearly every day this holiday season, Adobe predicts, Internet Retailer, October, 2016.
xiii. Online retailers strive to overcome integration challenges, Avaya, April, 2014.
xiv. The Future of In-Store Kiosks - 3 Ways Endless Aisle Blends Full-Serve and Self-Serve, Retail Dive, September, 2016.
xv. Knowledgeable, Empowered Associates Sell 87% More, Survey Confirms, Retail Touchpoints, June, 2014.
xvi. Free shipping leads to happy holiday customers, PYMNTS, November, 2016.
xvii. Higher shipping fees will force e-retailers to adjust, Internet Retailer, October, 2016.
xviii. 20% of US residents belong to Amazon Prime, Internet Retailer, October, 2016.