After the financial crisis of 2008, governments across the globe formed regulatory bodies and passed new regulations for enhanced supervision, effective resolution planning and higher loss absorbency of financial service organizations. This paper focuses on one of the key regulations in the insurance industry - Solvency II - which gained traction particularly after the financial crisis. The EU legislation adopted the Solvency II Directive in November 2009, to be implemented in all 28 Member States, including the UK, in order to improve customer protection, modernize supervision, deepen integration (within the EU) and expand insurers' competitiveness. The legislative programme got amended by Directive 2014/51/EU of the European Parliament and European Council on April 16, 2014 (the so-called "Omnibus II Directive") After more than 10 years in the making, Solvency II was implemented beginning January, 2016.
The Solvency II framework directive introduced a new, harmonized EU-wide insurance regulatory regime. Solvency II replaced 14 EU insurance directives of Solvency 1. Exhibit 1 provides a brief snapshot of what Solvency II entails.
While implementation of Solvency II is likely to cause no visible impact on revenue growth, profitability is expected to be hampered primarily for high risks businesses where capital requirements are high. Exhibit 2 highlights the impact of Solvency II on the revenue growth and profitability of European insurers.
While all the insurers have already implemented certain measures (related to technologies and systems) to get ready for the provisions of Solvency II, companies must still reduce business
complexities to function effectively and efficiently in this stringent operating environment going forward. Business complexities could result from having growing portfolio of products, legacy IT systems, disparate processes and multiple channels, leading to higher operational costs for the insurers. Most of these business complexities will also increase risks, push up capital requirements and hurt the growth potential of the insurers. Insurance firms can optimize operations to pare down costs and can leverage digital technologies to reduce business complexities and offset the potential reinvestment risk arising from prolonged low interest rate environment. Further, as Solvency II places greater emphasis on risks (primarily in terms of capital requirement), optimal risk management strategies are the need of the hour. In this respect, WNS DecisionPoint™ conducted a study, as highlighted in Exhibit 3, to determine the significance of insurers' risk management strategies in relation to shareholder value (returns).
The study considered Underwriting Efficiency Ratio (UR, calculated by dividing Operating Expense/ Insurance Income) as a measure of insurance risk, and the investment yield (IY) as an indicator of market risk. The analysis revealed that Property and Casualty (P&C) insurers with low insurance and market risks outperformed their peers in terms of shareholder value creation.
However, in the case of life and multi-line insurance businesses, shareholder value creation was linked to insurers having an optimal level (defined in Exhibit 3) in terms of both underwriting and investment risks. Companies with high or low insurance risks or high
or low market risks (partially optimal, defined in Exhibit 3)
both (sub-optimal, defined in Exhibit 3) underperformed in
of shareholder value creation compared to those that had optimal levels of insurance and market risks.
Deciding on the optimal level of insurance and market risks in the case of life insurance business can be tricky. However, drafting growth strategies according to the market attractiveness and intensity of competition in a particular geography where the insurer operates can help optimize risks. Companies should also consider their own capabilities while chalking out their growth strategies.
The reason for stock markets approving different risk management strategies for P&C and Life and Health (L&H) insurers could be due to the different nature of the businesses. P&C businesses are primarily dependent on policy renewals and frequent risk assessments, and are short term in nature. Life insurance companies, on the other hand, receive recurring premiums and pay losses slowly. Hence, the underwriting and market risk requirements of both the businesses tend to differ. Exhibit 3 highlights the risk-return levels of insurers by product mix in the EU.
As reflected in Exhibit 3.4, managing risks optimally, i.e. effectively (neither high nor low) in case of L&H and Multi-line and efficiently (low risks) in P&C (General Insurance), tend to lead to higher shareholder returns. On an average (overall basis), the Optimal RR category insurers witnessed an improvement of 92.9 percent
in their share price compared to an only 30.0 percent change in case of Partially Optimal/Sub-optimal categories of insurers. It was also identified that new business growth had a far lesser bearing (as compared to underwriting and market risks) on the shareholder value accretion for L&H insurers with moderate to high UR. However, insurers with low UR need to generate enough new business growth to garner shareholder value which may push the UR higher in the future. This paper focuses on how to manage risks optimally and lays down a clear roadmap and guidelines to achieve the end- objective of managing growth post Solvency II implementation. As a precursor, however, the paper aims to understand the impact of Solvency II on insurers' value chain so as to understand, which business functions insurers should focus upon more.
Risk Management, Actuarial, Finance And Asset Management Functions Have Been Highly Impacted By Solvency II
Solvency II requires insurers to adapt to 1) new solvency calculation models, data management processes and complex reporting requirements to evaluate the risk exposure; 2) faster internal and external reporting mechanisms; 3) data integration across various lines of businesses and geographies. All these requirements had a net impact on insurers' administrative costs associated with Solvency II.
The UK insurers have only invested ~ £3 billioni to be compliant with Solvency II apart from the business-as-usual costs they incur ever year. WNS DecisionPoint™conducted a survey to assess the impact of Solvency II on the insurers' business model. Predictably, the survey showed that most of the impact of Solvency II was felt on risk management, actuarial, finance and asset management functions as reflected in Exhibit 4 below.
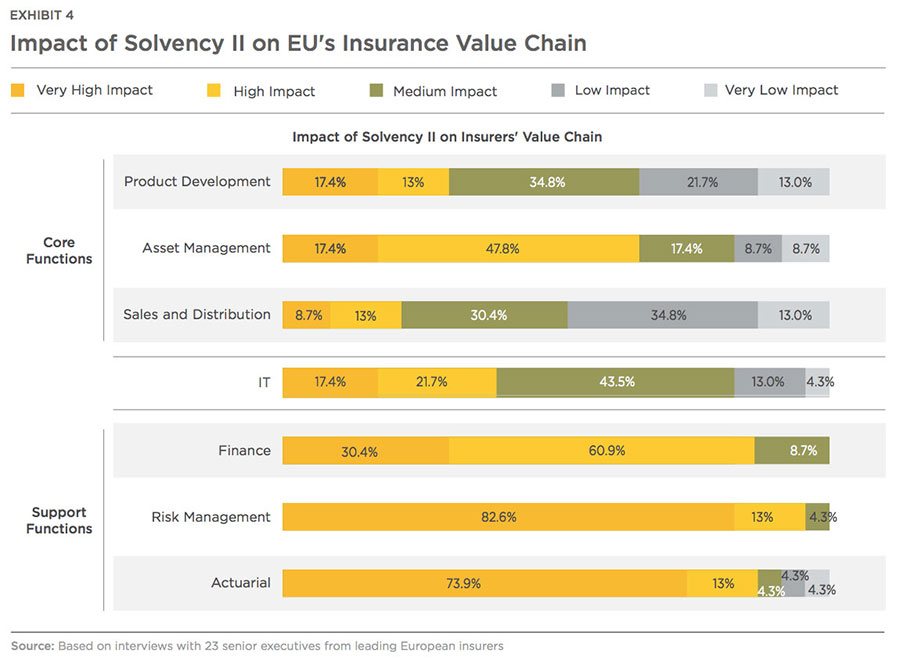
Apart from capital requirements, risk management is at the core of Solvency II. A robust risk management system should be able to continuously identify, measure, monitor, manage, and report risks at an individual and aggregate level. It should also be able to find out the incurred and potential risks and their interdependencies. These risks include those related to market, credit, underwriting and operations.
The actuarial function is another key function in the new system of governance under Solvency II It needs to coordinate the calculation of technical provisions, ensure the use of appropriate methods, models and assumptions, assess data quality, express opinions on underwriting policies, and appraise the adequacy of reinsurance arrangements.
The finance function needs to take care of faster reporting requirements and adopt relevant valuation methodologies.
On the IT front, legacy systems and siloed business units prevent the data aggregation needed for reliable, fact-based decisions. Data quality management seems to be the other main issue, probably due to multiple legacy systems and disparate solutions. Inadequate IT capabilities could make it difficult to quickly and accurately value assets and liabilities.
Asset/investment management becomes strictly important for insurers because of inherently higher underwriting efficiency ratios as shown earlier in the EU insurance business which forces them to make money via investments.
Use Of Analytics In Core Functions Is Exceedingly High
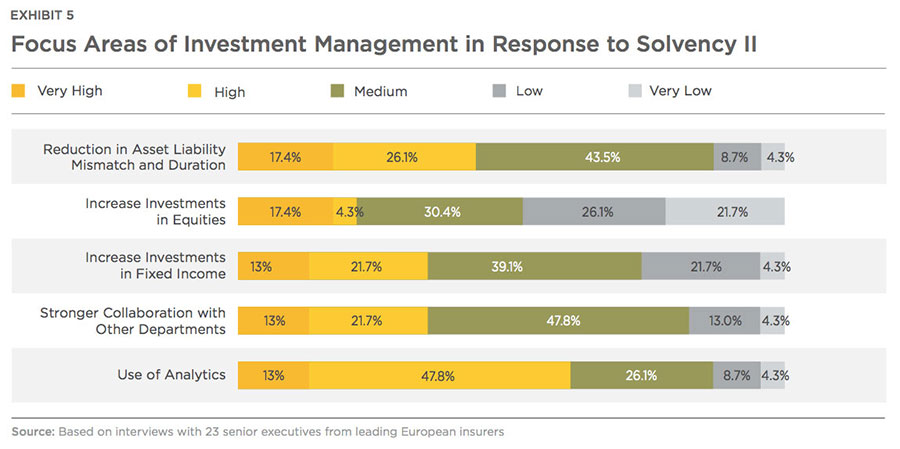
Amongst core operations, maximum impact is being felt by the asset management division as market risk and counter-party credit risk originates from investments. Asset managers need to take into account capital requirements arising out of the assets held and investments made. Asset managers need to consistently track asset exposures towards issuers, sectors, currencies and countries given the rising market volatility, largely post the financial crisis of 2008. Having this information on a daily or real-time basis rather than on a monthly or quarterly basis can enable effective management of the market, counterparty and country risks. Apart from managing the aforementioned risks, reduction in asset-liability mismatch is one of the main focus areas of asset managers to mitigate market risk/liquidity risk and lower capital requirements. Exhibit 5 lists the key priorities of the investment/asset management function.
Around 87 percent of the EU insurers use insights from analytical tools and technologies significantly (medium to very high focus) to make investment decisions
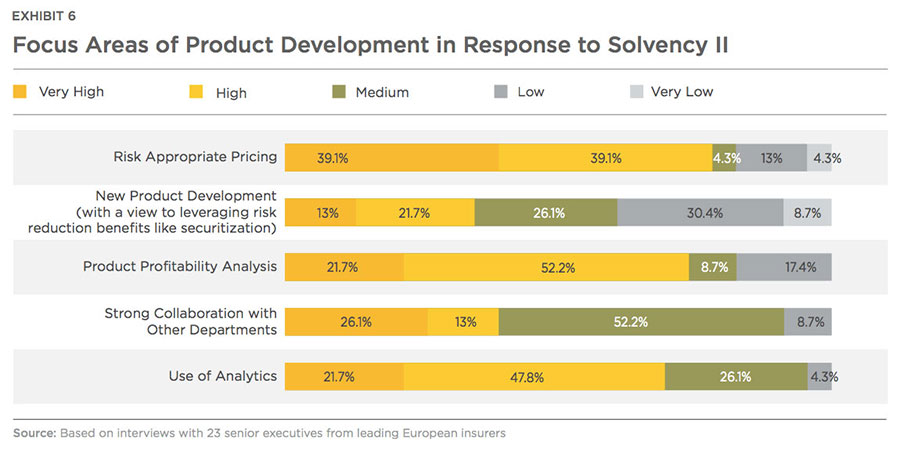
With customers increasingly seeking sophisticated, customizable products at lower costs and Solvency II making insurers take into account the capital requirements and investment side of the business when designing products, product development is also feeling pressure to improve. The focus areas for improvement are in use of analytics, risk appropriate pricing or pricing-centered policy features and product profitability analysis. The main aim for all these strategies is to lessen underwriting risks. One reason analytics is receiving so much focus is that it allows for the tracking of product portfolio exposure to mortality, longevity, health, catastrophe risks and other such concerns. Given the sufficient overlap in goals, both risk managers and asset managers are also likely to play a key role in product development and design. Exhibit 6 displays the key focus areas of product development division for EU insurers in response to Solvency II.
Sales and distribution of insurance products are comparatively less impacted due to Solvency II. However, underwriting's importance could reshape sales and distribution channels in the future. Distribution models need to be evaluated to check the suitability of some products. Certain policies may only be profitable if their customer acquisition costs or sales incentives are below a certain threshold. For now, as companies are becoming stricter in terms of underwriting risks, sales and distribution are using analytics to predict frauds. Focus areas of sales and distribution department are shown below in Exhibit 7.
Significant use of analytics is ubiquitous in the product development phase
Solvency II requires changes to technology processes, data and IT application architecture, and actuarial modeling functionality. Moreover, Solvency II requires firms to collect and prepare data faster and accurately. IT departments are primarily concentrating on better collaboration with other departments (as reflected in Exhibit
8) to implement and maintain the Solvency II requirements with most of the investments already being made in development of the applications and functionalities.
Outsourcing Has Been Nominal In Support Functions And Is Likely To Increase Gradually Post Solvency II
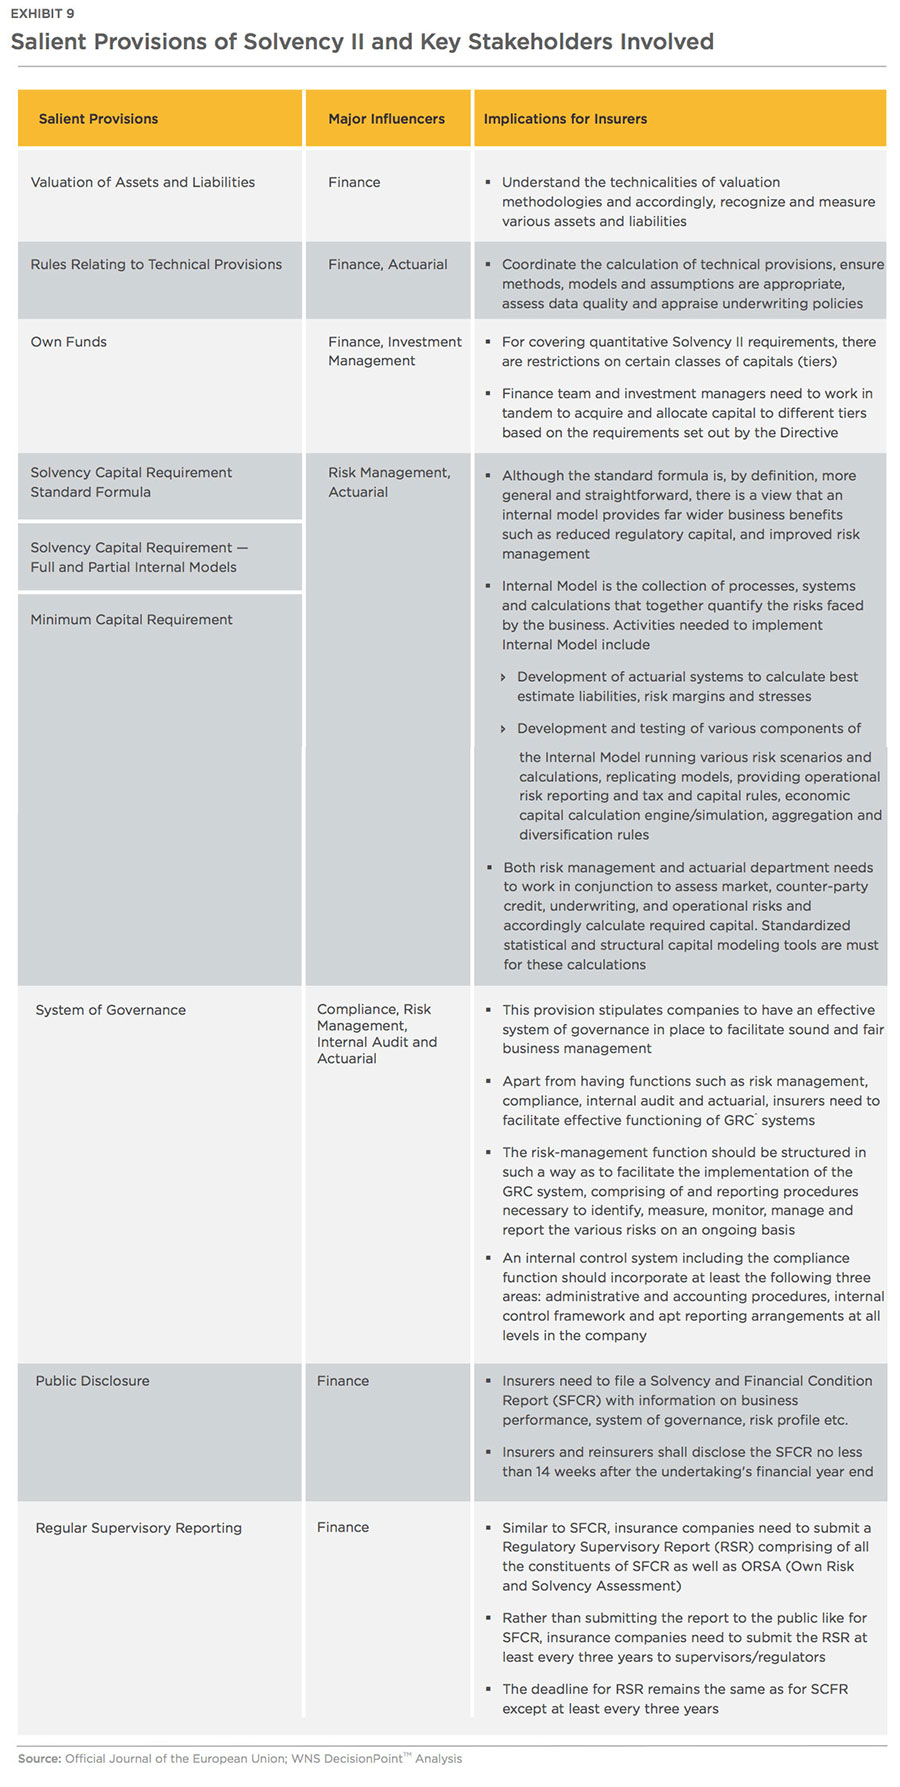
The directive (Solvency II) laid down certain key provisions, which prompted the redesign of insurers' support functions. For example:
1) Provisions related to the Valuation of Assets and Liabilities require an insurer to maintain consistency with regard to accounting standards. 2) Rules relating to Technical Provisions require insurers to set up technical provisions (normally the largest item on an insurer's balance sheet), which correspond to the current amount they would have to pay if they were to immediately transfer their (re)insurance obligations to another company. The value of the technical provisions is equal to the sum of a best estimate and a risk margin. In the first case mentioned above, Finance department needs to understand the technicalities of valuation methodologies and accordingly, recognize and measure various assets and liabilities quickly. In the second case, actuarial and finance departments will play a significant role in adhering to the provisions. Actuarial function needs to coordinate with the calculation of technical provisions, ensure the appropriateness of methods, models and assumptions, assess data quality, appraise underwriting policies and help in adhering to the Solvency II requirements. Exhibit 9 lists down key provisions of Solvency II and their impact on different elements of insurance value chain.
Outsourcing levels, which were low before the implementation of Solvency II, are likely to pick up marginally post implementation. Some of the plausible causes for outsourcing support functions could be the requirements around performing complex capital calculations, risk assessments and reporting in shorter periods of time, higher data quality and new data management processes. Marginal increase in outsourcing of support functions seems to be more applicable for large players. Most of the smaller players still do not have the required resources for actuarial and risk assessment related work.
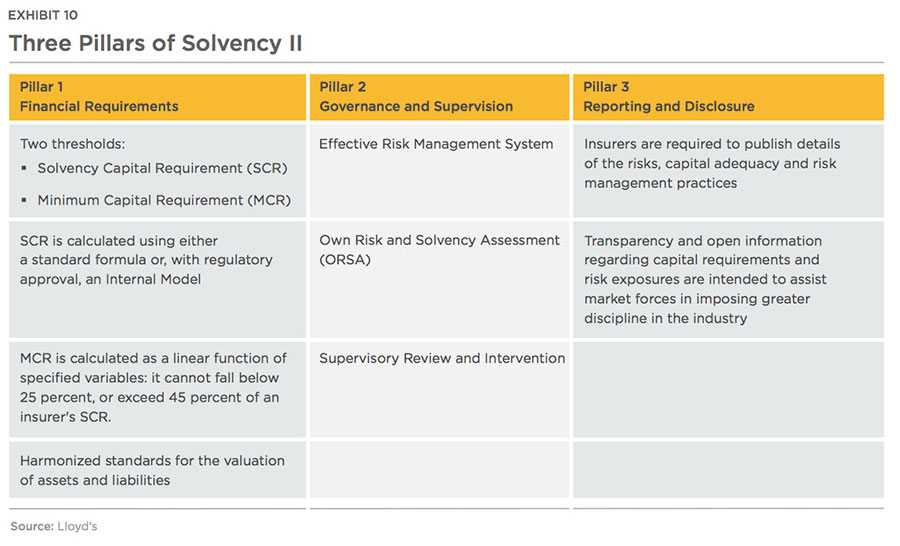
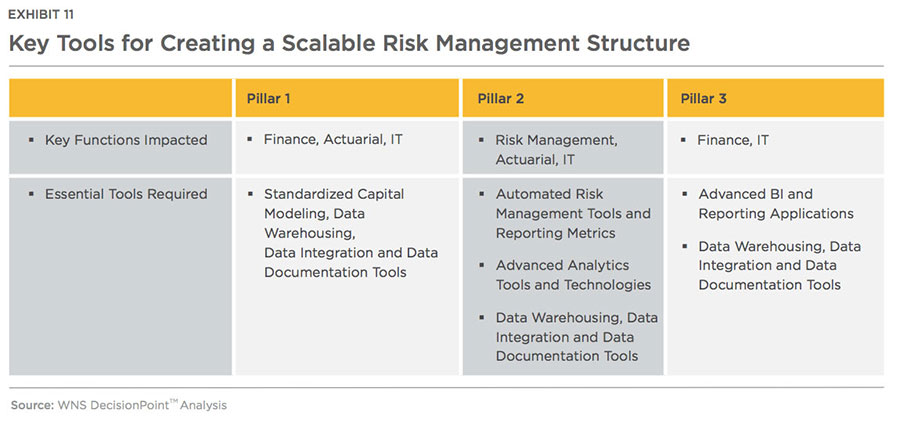
Exhibit 11 lays down certain essential tools for creating a scalable structure across the three pillars depicted in Exhibit 10.
Outsourcing penetration had been pretty limited in pre-Solvency II era and is expected to marginally increase post implementation in risk management primarily for better risk assessments as reflected in Exhibit 12 and 13. Calculation of value-at-risk and stress tests scenarios, credit assessment, automation of risk reporting metrics and compliance with anti- money laundering and know your customer laws are the commonly outsourced areas in risk management.
Actuarial function, on the other hand, is expected to witness decrease in outsourcing activity levels post Solvency II
implementation (refer Exhibit 14 and 15). One of the probable reasons for the decrease could be that complex calculation models
are already in place and will just need data entry and maintenance.
Finance function is likely to register an uptake, though marginally, on account of faster reporting requirements. Exhibit 16 and 17 depicts the outsourcing activity levels in finance function in pre and post Solvency II era.
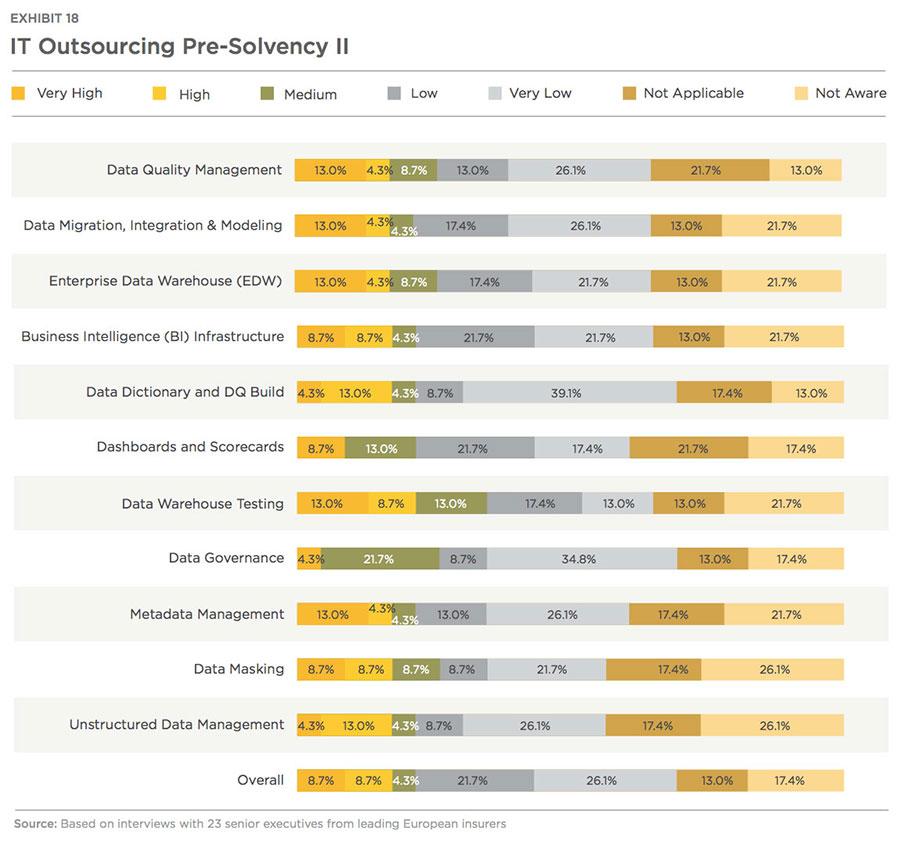
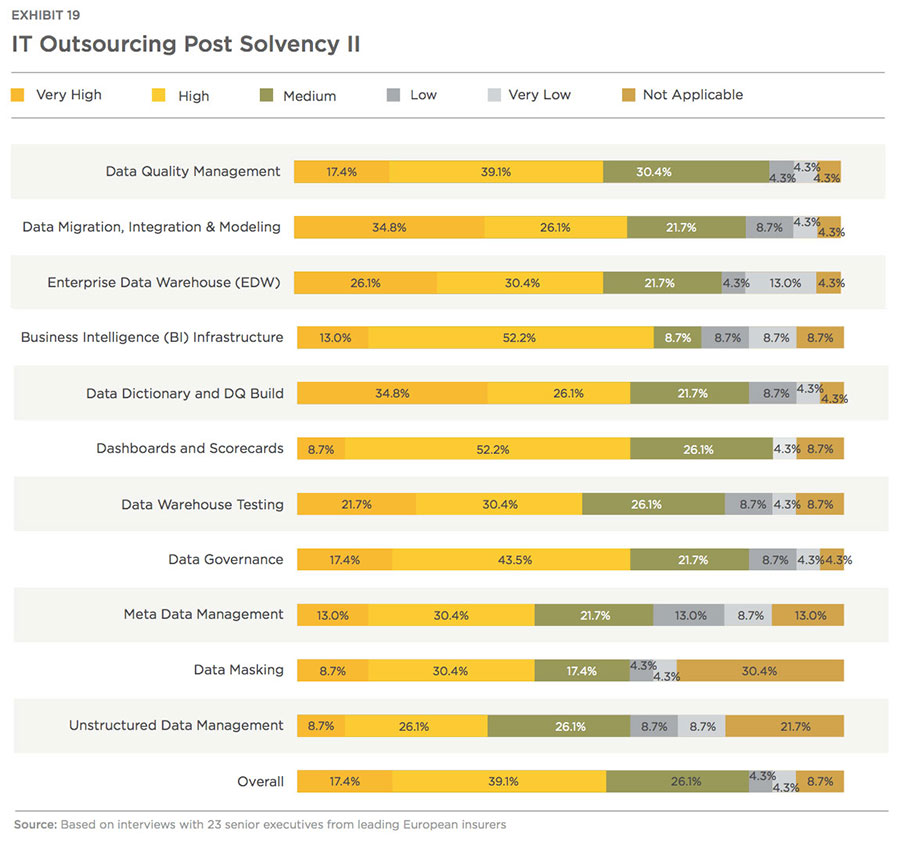
IT outsourcing is expected to register the highest increase going forward as firms look to reduce legacy systems in policy servicing and claims management and enable straight through processing via automation. The aim for the majority of insurers is to simplify and standardize processes and systems in order to reduce operating costs and accelerate the speed to market of new products. Exhibit 18 and 19 highlight the levels of outsourcing in pre and post Solvency II implementation.
Optimize Risk-Returns Prudently
Overall, consumers plan to spend on an average USD 998 on With Solvency II impacting the whole insurance value chain (particularly investment management and support functions) and making capital requirements linked to the insurer's risk profile, industry players have made relevant adjustments, whether they be reducing duration,
adopting risk-appropriate pricing, streamlining systems, changing product mix and so on, to reduce risks, as stated above. Cutting down risks may yield higher shareholder returns in case of P&C business but could pare share price gains in case of life and health insurance as witnessed above in
Exhibit 3. Different risk requirements are needed for P&C and L&H businesses to garner higher shareholder value as depicted in Exhibit 3. Following three approaches, in our experience, can help companies achieve the objective of managing risks prudently:
- Carefully manage all risks with robust risk assessment frameworks to make suitable adjustments
-
Handle risks optimally to achieve higher returns with minimum capital requirements
- Optimize operations and leverage digital technologies to reduce costs and offset potential losses from various risks
Robust Risk Assessment Frameworks To Make Suitable Adjustments
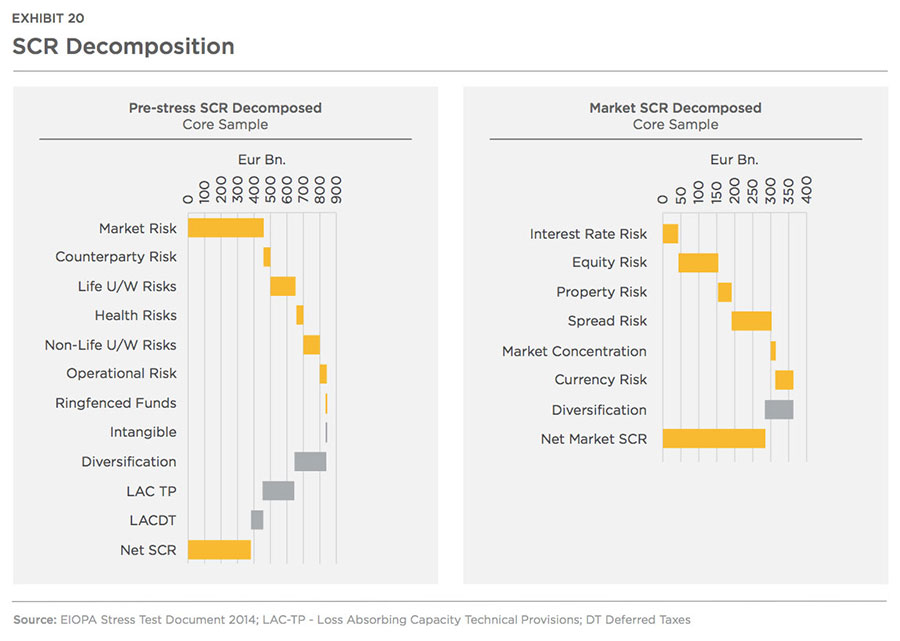
The SCR is calculated based on the specific risks borne by an insurance company in relation to both its assets and liabilities. The SCR should correspond to the value-at- risk (VaR) of the basic own funds of an insurance company subject to a confidence level of 99.5 percent over a one-year period. The SCR takes five main risks categories into account: 1. Underwriting risk 2. Market risk 3. Counterparty (default) risk 4. Intangible risk and 5. Operational risk. Capital management, thus, becomes a multi-faceted exercise in Solvency II and has emerged as the key input parameter in building strategies around asset management, product development and underwriting functions. The primary reason for this multi-faceted role of capital management is the risks involved in each of the aforesaid core functions. Asset/investment management mainly deals with market risks and counterparty risks while product development and underwriting functions mainly deal with risks related to mortality, morbidity, longevity, fire, accident, catastrophes etc. Operational risks are related to inefficient systems, people and technology and impact the whole business of insurers. For each module (for example: market risk) and sub-module (for example: equity risk), insurers have to calculate the corresponding capital requirement, using stress scenarios. Exhibit 20 demonstrates the risks contribution to capital requirements of EU insurers.
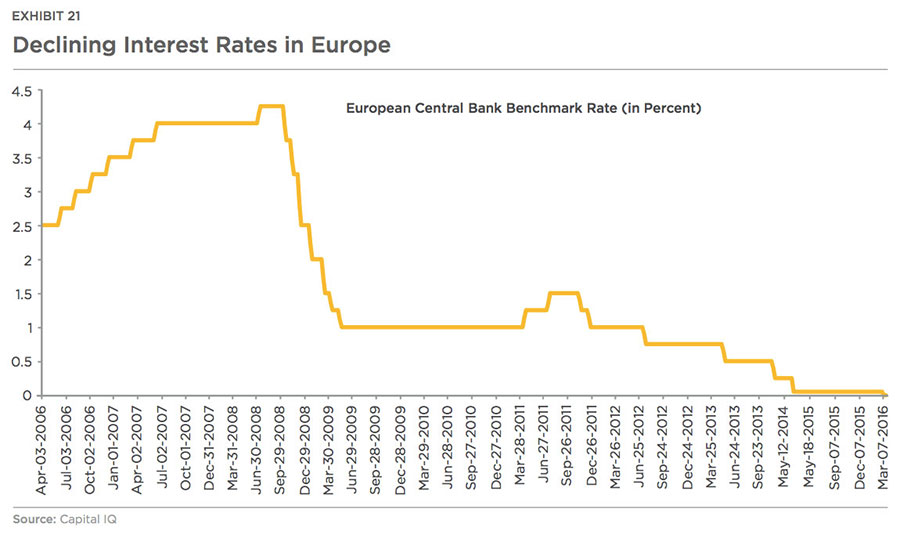
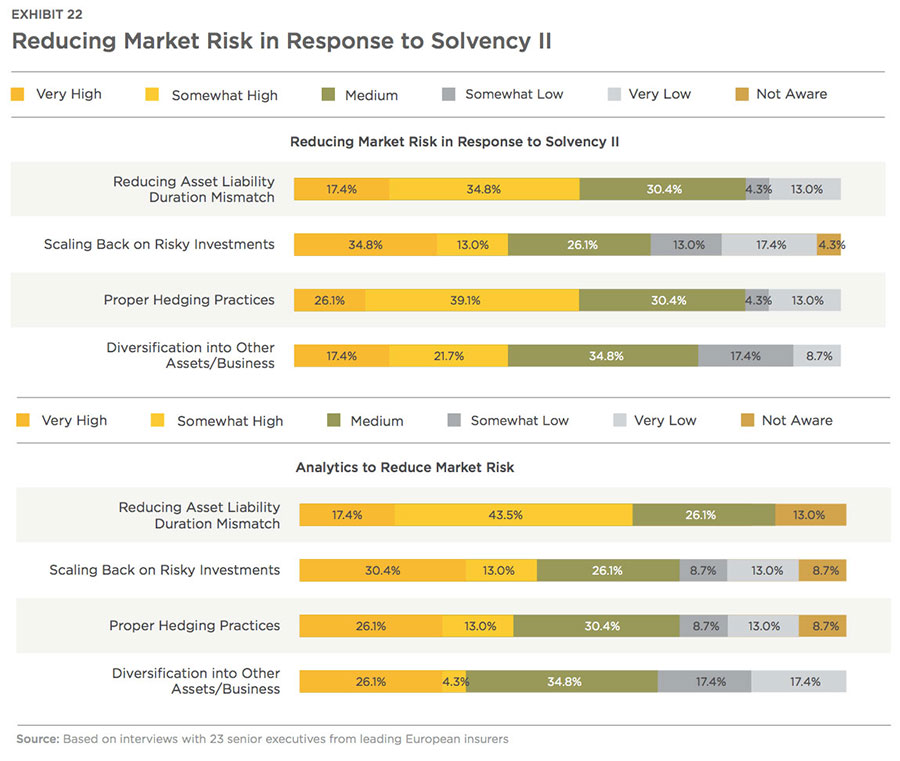
Market risk is the risk of loss caused due to adverse movements in interest rate, equity, property, credit spread, market concentration and currency risks after adjusting for diversification levels. With prolonged low interest rate environment as reflected in Exhibit 21, earning sufficient return on reinvestments (fixed income, primarily, which forms the majority of the insurers' investment portfolio) is getting difficult. Reducing duration mismatch and proper hedging practices are on top of executives' mind to control or reduce the market risks arising out of investments in financial instruments.
Apart from tracking exposures related to all investments, understanding their relationship with certain key drivers (interest rates, commodity prices, consumer spending, GDP growth, fiscal deficit etc.) and tracking their movement is also of utmost importance. For example, successful insurers look at the relationship between bond and interest rates via statistical techniques, apart from the bond convexity, to make decisions around portfolio composition and adjustments. Once the relationship is identified, insurers can predict the changes in interest rates via regressing on more than one outcome variable (using its expected value) such as inflation, GDP growth, fiscal deficit, foreign exchange among others. The same exercise can be applied with equity returns as the dependent variable regressed with other relevant independent variables. These interdependencies will help insurance organizations to make the right decisions regarding portfolio adjustments at the right time. Moreover, apart from tracking exposure to various assets and sectors and the above outcome variables, insights on credit rating of (bond) issuers need to be continuously tracked and necessary actions taken to optimally alter portfolio allocation strategies. For example, prolonged low crude oil and commodity prices have led to many oil and gas and commodity producers to file for bankruptcy or witness their credit ratings slump leading to significant losses for insurers due to a decline in bond values. Having information on all these developments in real-time or at the right time can help insurers cut their investment exposure and save lots of funds. Country-specific political and operational risks (such as sanctions) also need to be tracked. Insurance companies have been adopting advanced data analytics tools and technologies to track exposures and identify relationships with associated
key drivers.
Underwriting risks consists of premium and reserve risks in the P&C segment as well as biometric risks in the Life/Health business segment. Premium risk is subdivided into natural catastrophe risk, terror risk, and non- catastrophe risk. There should be clear centrally defined underwriting limits and restrictions in place.
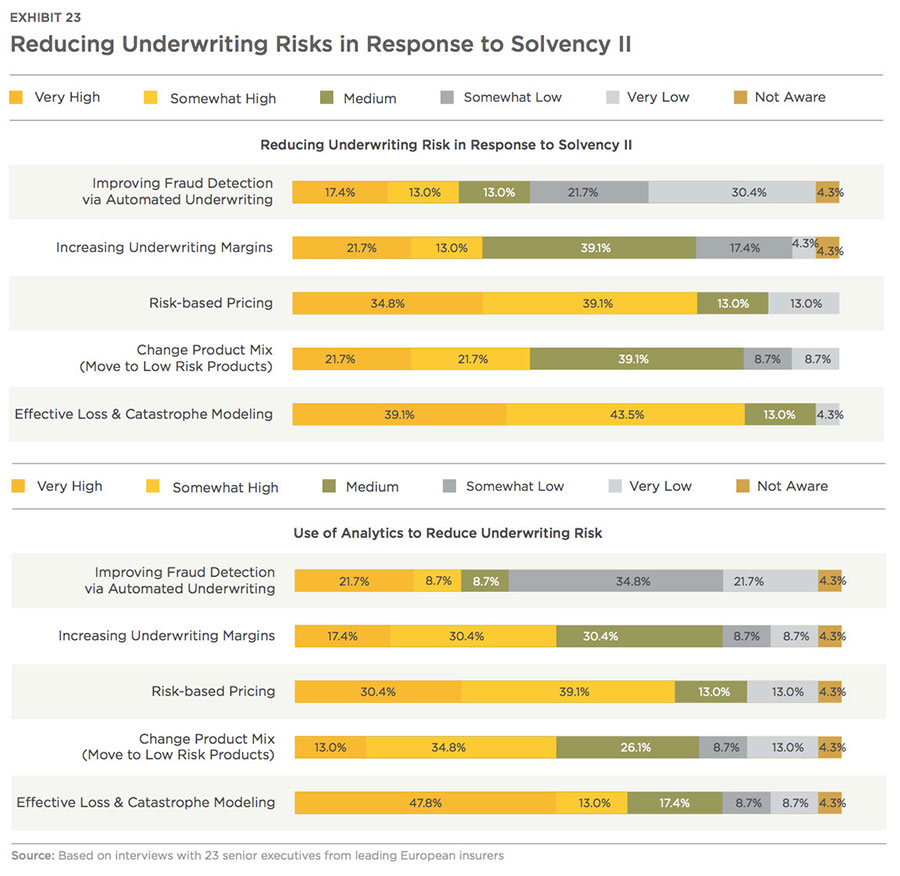
In addition, the local operating entities can have limits in place that take into account their business environments. Excessive risks should be mitigated through external reinsurance agreements. For estimating the losses from natural disasters, insurance firms can use special catastrophic modeling techniques. These new models are not only statistically driven but consider the structural drivers in the event of a natural disaster. This level of analysis is now possible because of the availability of big data tools and technologies. Though in its infancy, assessing pandemic risk is another example where this kind of structural risk modeling can be applied. By assessing such risks correctly, insurance firms can proactively inform customers about the predicted catastrophes (climate change and their impact) and disease outbreaks and implement measures (sending messages in advance related to natural disasters such as earthquake and floods and relevant preventive measures) to reduce the claims costs. Estimation of these events and accurate prediction of losses will also help insurers to maintain adequate reserves to pay out claims, helping them make optimal capital allocation. Controlling claims via advanced risk based pricing and effective loss and catastrophic modeling tools seem to be high on the agenda for insurers in Europe as depicted below in Exhibit 23.
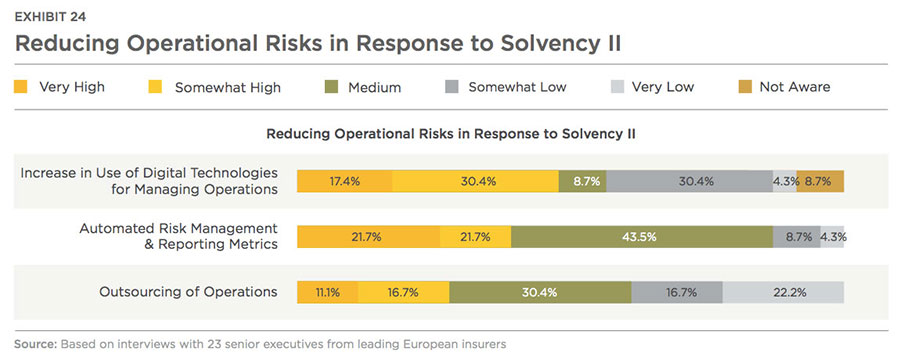
Operational risk, for capital purposes, is defined as the risk of loss from inadequate or failed internal processes, people, and systems or from external events. To reduce risk arising from such failures, organizations need to record and assess their risk frameworks, including processes, risks, events, key risk indicators (KRI) and controls. Through dashboards and reports that highlight key risk metrics such as Value at Risk and policy compliance, executives can stay on top of organizational risk activities. Companies must employ business process automation capabilities that provide for real-time event escalation, automated risk processes, and efficient remediation of problems and action items. In addition, outsourcing of operations such as claims processing and managing policy servicing and policy issuance are being focused on in order to reduce operational risks. Insurers should have a business continuity and crisis management framework (including for outsourcing vendors) which strives to protect critical business functions from the above mentioned failures and enables them to carry out core tasks on time and in compliance with the highest standards. This framework should be embedded within the overall risk management process. Firms should also work on a cyber and information security program on an ongoing basis, in order to better respond to current external developments and to further strengthen the internal control environment around related operational risks. Exhibit 24 lists the priorities of EU insurance firms to tackle operational risks.
Solvency II requires insurers to change the risk culture. Given the risk-based capital requirements, it's imperative to have a scientific approach to risk management. Risk management now plays a pivotal role in board meetings and strategic decisions. It is no longer just a compliance element, but a critical pillar in determining winners and losers. Exhibit 25 highlights the varying maturity levels of risk management frameworks being adopted across insurance businesses.
Handle Risks Optimally To Achieve Higher Returns
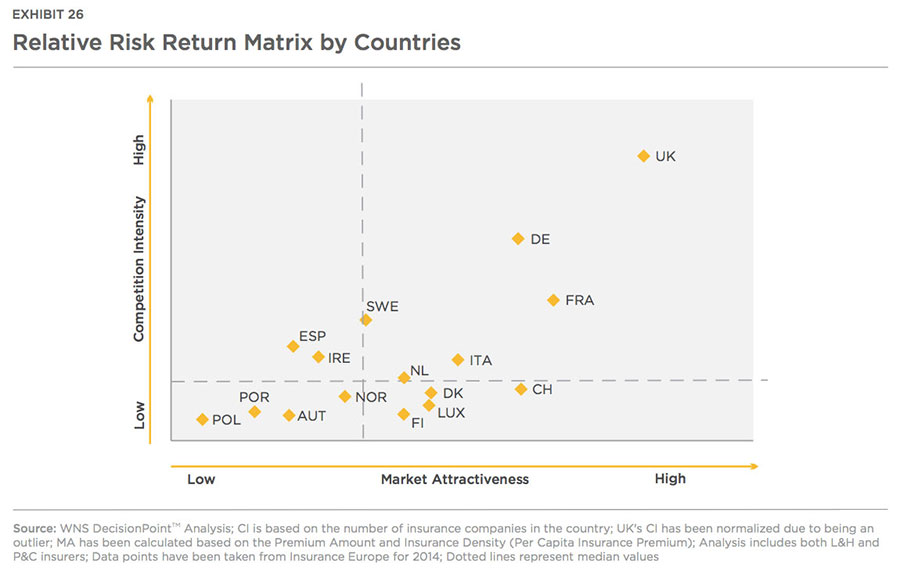
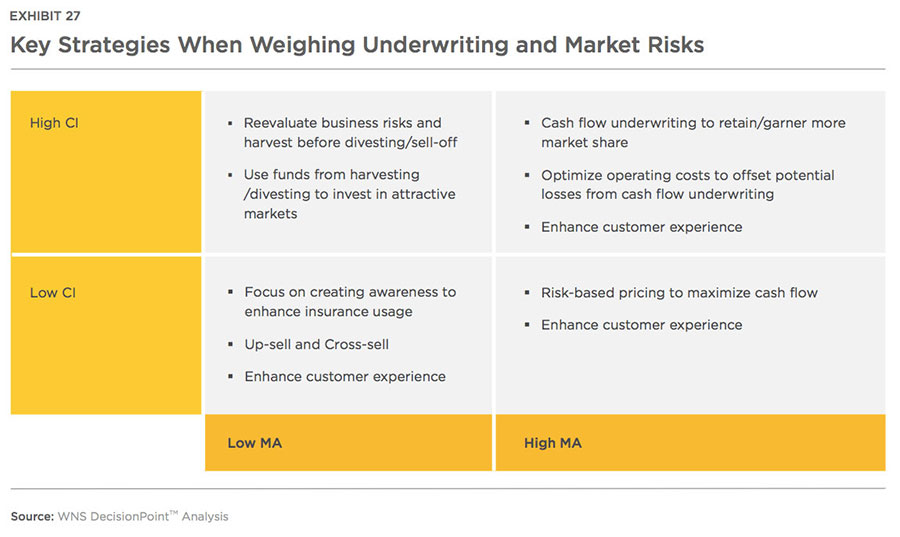
As discussed above, reducing risks could boost shareholder returns for P&C insurance but may trim the gains for L&H players. Insurers in the EU insurance market have relied heavily on cash flow underwriting during the last few years wherein the insurance products are priced well below the expected losses and expenses to be incurred. The aim of this strategy is to garner market share and create larger investment pool and then invest in vehicles providing higher rates of return making up for the differences in lower pricing. Testament to the aforementioned approach is that top 20 public insurers have reported average underwriting efficiency ratio of 116 percent during the last five yearsii. Many insurers are resorting to risk-based pricing in response to Solvency II. However, given the commoditized nature of insurance products and intense competition prevailing in the European Insurance sector, the strategy of risk-based pricing may not yield desired results. On the other hand, resorting to vehicles/investment assets expected to provide higher rates of return will lead to higher capital requirements as market risk rises. Hence, insurers should carefully weigh underwriting risks and market risks based on the geography they operate in, considering the competition intensity (CI) and the market attractiveness (MA) as highlighted in Exhibit 26 and 27. WNS DecisionPoint™ studied 16 countries (in overall insurance market including P&C, L&H as well as Multi-Line insurance) in Europe to understand where they fit in each of the above categories.
To win in this stringent regulatory environment, companies need to continuously track competitor activities and redesign their strategies and tactics, accordingly. In addition, insurers should focus on understanding customer behavior and preferences to provide a personalized experience and reduce underwriting risks (such as fraud). The path to effective personalization, detection of fraud and streamlined underwriting processes lies in adoption of data analytics, which can provide a much more comprehensive view of the customer to the insurer than was available before. This is because of the availability of improved and new technologies (Big Data storage, processing and visualization) which integrate information from different sources more accurately and quickly. Companies are making investments in big data technologies such as Hadoop to process both structured and unstructured data. There is likely to be a growing use of automated tools to detect patterns in unstructured data. Meaning Based Computing (MBC) is one such tool which recognizes all forms of unstructured data. Next- generation MBC technologies connect various data formats (audio, video, emails, tweets, comments etc.), recognize relationships and concepts, and then send trigger actions across all customer-facing channels. These types of automated tools use various techniques such as text tagging, annotation, ontology and so on to provide standardized and processed information at speeds demanded by end users and business processes and help reduce risks. As discussed earlier, insurance firms are also using structural modeling techniques (for accurate prediction of catastrophes and pandemics) and big data analytics for risk-based pricing. Insurers are also focusing on detecting and preventing fraud with the adoption of big data analytics. As per Insurance Europe, detected and undetected fraud is estimated to account for up to 10 percent of all claims expenditure in Europe. Apart from using advanced analytics tools to minimize the losses from fraud, EU insurers are exchanging information and extending co-operation with law enforcement agencies. Commonly used data analysis techniques adopted for fraud detection and minimization along with their future adoption have been depicted in Exhibit 28.
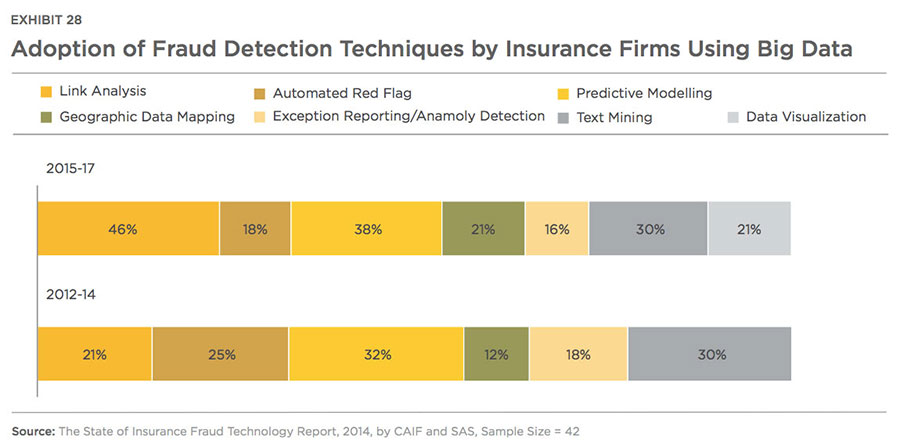
Insurers have also partnered with specialist service providers, who proactively identify emerging fraud patterns through predictive modeling, link analysis and other various advanced techniques or combinations of analytical techniques. Common benefits reported by insurers have been improvements in referral time, a greater number of referrals, reduction in investigation time and lower investigation costs apart, from reduced fraud. For more details on detecting frauds efficiently and effectively, please refer "Insurance Fraud Detection and Prevention in the Era of Big Data"
On the customer experience front, insurers should consider the following four elements when designing the customer experience:
- Customers and distributors including agents, brokers, employers, individual consumers etc.
- Customer-touch-points such as smartphone apps, agents, claims adjustors, website, brokers, contact center representatives etc.
- Interaction types (buying journey) covering requesting information, submitting claims, receiving or comparing quotes, making a payment etc.
- Drivers for purchase/drop-out such as unsatisfactory, claims handling experience, pricing, brand image
Understanding and studying these parameters and cross-analyzing them with customer segmentation based on psychographic, demographic and financial attributes will generate unique insights. Such insights help carriers provide the right information /product via right channel to the right customer at the right price and, therefore, aid in reducing the underwriting risk. Let us look at an illustrative segmentation by age group for a life insurance company in the UK in Exhibit 29:
Optimize Operations And Leverage Digital To Reduce Costs
In order to reduce risks and lower capital requirements, insurers are building balance sheet strength by reducing duration mismatch and restructuring their business model. Many insurers are optimizing costs and simplifying their business model to offset reduced pricing on account of competition and also lower reinvestment risk due to prolonged low interest rate environment. The table below highlights the top strategies adopted by select big insurers in the recent past.
Cost optimization seems to be high on the priority list of insurers as per Exhibit 30. In our experience, key reasons for cost over-runs in an insurance organization happen mainly because of high business complexity owing to
- A multitude of products, brands, core processes and distribution channels
- Disparate back-office/back-end functions spread over numerous locations
- Fragmented IT landscape with legacy systems
Growth plans including mergers and acquisitions and geographic expansions are key factors leading to higher business complexity. To manage the business growth without increasing risks, firms need to simplify their business processes and limit the number of products based on the value they offer to the customers and their profitability levels. Insurance firms should stop issuing products with low customer value and low profitability. Areas such as underwriting, closed-book operations, claims management, CRM and policy administration should be centralized into one target system to enable straight through processing. Cloud computing should play a critical role in the modernization of these systems particularly those related to policy administration, claims management, and billings
and payments.
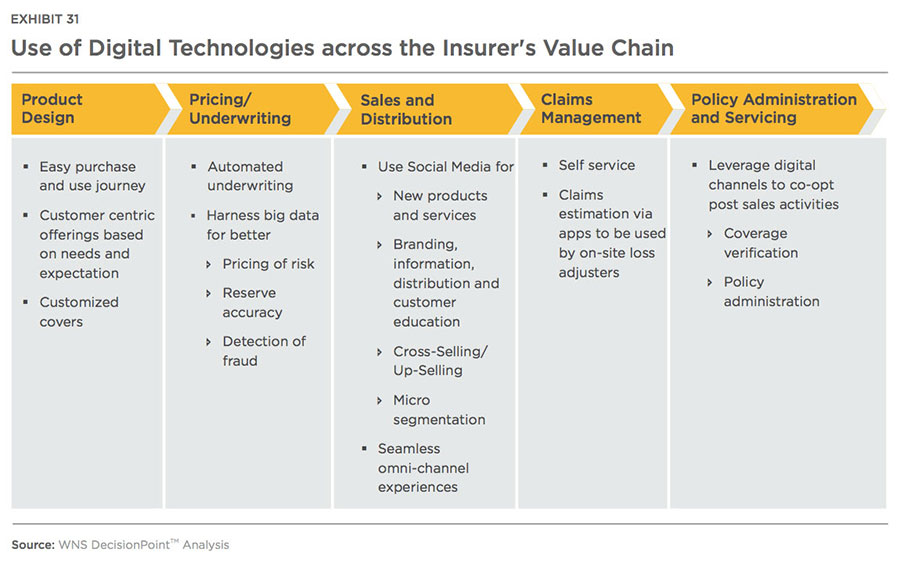
Insurance firms are also leveraging other digital technologies (such as big data and analytics, mobility and social media) to optimize operations and reduce risks. Digitalization is not merely a tool to streamline internal processes to achieve operational efficiency; rather, it is a multidimensional change permeating innovation in products, services, processes, and business models and reshaping the customer experience journey design. Insurers can enhance customer centricity and become their partner of choice by creating fully modular products that can be explored and purchased online and enabling management of the claims process via an app. Exhibit 31 highlights key uses of digital technologies across the insurance value chain.
Senior Executive Sponsorship Is A Must For Managing Growth In Tough Environment
If the insurers are unable to maintain sufficient growth and are generating utility-like (low) returns, capital will flow out of their businesses and into the hands of outperforming competitors and other attractive sectors. To manage growth successfully post Solvency II implementation, insurance companies can adopt measures as described above. While some of the companies are already making efforts in order to successfully manage growth post Solvency II, the RR management should be optimal. Measures discussed above to achieve optimal RR will require business transformation and a robust change management programme involving system upgrades, divestments of low value products and lines of businesses, spin-off/closures of operations in unprofitable countries and leadership commitment. Companies also need to infuse analytics within decision making (related to risk) processes to manage and monitor risk, and assess capital requirements. Analytics tools and technologies aid in performing complex calculations to anticipate risks along with identifying the current risk hotspots across the organization. This helps in computing capital adequacy and taking control measures to satisfy capital requirements. Insurance carriers should also opt for external help mainly via partnerships with third-party outsourcing vendors and consultants.
Insurance companies' budgets might have been strained particularly after complying with the Solvency II regulations. Senior executives must necessarily commit investments to identify problem areas within their organizations and take measures to achieve the desired state of managing risks and returns. This is where the role of consultants and third-party service providers with deep industry knowledge will come into play. A strategic relationship with a credible partner is vital to optimize operations and reduce costs. Insurance firms need to continually benchmark, in terms of cost of operations and process performance measures, against peers to address operating model transformation, including significantly improved use of digital technologies, via adoption of best practices.
References:
i. News by Bloomberg, U.K.'s Prudential Reports New Solvency Capital Ratio of 190 percent, 2016
Acknowledgments:
a) Report by J.P. Morgan Cazenove, Solvency II - an uncertain risk but looks manageable, 2015
b) Survey by Ernst & Young, European Solvency II Survey, 2014
c) Report by KPMG, Evolving Insurance Regulation, 2014 and 2015
d) Reports from Munich RE Knowledge Series
e) Report by McKinsey, Successfully reducing insurance operating costs, 2015
f) Report by AT Kearney, The Insurance Challenge: Managing Complexity
g) Blue Paper by Morgan Stanley and BCG, Insurance and Technology - Evolution and Revolution in a Digital World, 2014
h) FAQ Document by European Commission, 'SOLVENCY II': Frequently Asked Questions (FAQs)
I) Office Journal of the European Union, 2015