Insurance fraud is one of the biggest crimes in the U.S., reporting payout of $80 billion (for the entire insurance industry) every year, imposing heavy costs on insurers and its customers.
Point of sale (POS) fraud, also known as premium or underwriting fraud, takes place when the applicant purposely hides or distorts facts/information when obtaining insurance coverage. Fraud at the POS stage, which erodes 10 percent of insurance revenuei, is increasing due to a rise in digital sales channels, which make it easy for individuals to reduce premiums by easily manipulating data, such as age, previous claims and zip code, among others. To make matters worse, pressure on carriers to increase revenues and higher customer switch ratio limits underwriters from scrutinizing all the applications in detail.
Workers' compensation (part of commercial line insurance) is most exposed to such fraud, where employers avoid premiums by reporting fewer employees or inappropriately classifying employees with high-risk jobs as holding lower-risk ones. About 10-20 percent of employers in the U.S. misclassify at least one worker as an independent contractorii. Employers committing such fraud are higher in number in the Southern states, where around 30 percent of construction workers have been wrongly classified as independent contractors, amounting to annual losses of $400 million in Florida, $467 million in North Carolina, and $1.2 billion in Texasii.
The U.S. is also witnessing a higher rate of Organized Group Activity (OGA)3. The National Insurance Crime Bureau (NICB)4. reported a 14 percent rise in Organized Group/Ring Activity from 2,310 questionable claims (Qcs)5 for nine months (Q1-Q3) in 2012 to 2,643 QCs for nine months (Q1-Q3) in 2013iv. In 2012, NICB conducted a survey to examine OGA and reviewed 13,014 Qcs for the period January 2008 to June 2012. The top five states that generated the most questionable claims were: Florida (3,530), California (2,679), Michigan (1,080), Texas (1,050) and New York (765)v. Looking closer, three are 'No-Fault' states (Florida, Michigan, and New York), and one, Texas, although not 'No-Fault,' has partially adopted some 'No-Fault' policies. 'No-Fault' policies put much of the burden to pay on the injured party's own insurance company, regardless of fault, and impose a strict timeline within which the claim must be accepted or rejected. Although intended to simplify and expedite the claims process, these policies make it much easier to stage accidents and defraud insurance companies. Worse, the timelines make it difficult for insurers to detect fraud fast enough, and even if they do, they are often sued for negligence in their examination of the claim.
Fraud losses in personal line, mainly led by fraudulent auto injury claims, were estimated to rise in double digits over a two-year period and reach $18.5 billion, in 2014vi. Worse, because of liberal rules and dishonest lawyers, who support such crimes, 'No-Fault' states reported an even higher appearance of fraud for personal injury protection (PIP) claims (Florida - 31 percent, New York - 24 percent, Massachusetts - 22 percent, and Minnesota - 22 percent)vii.
Vulnerability of personal lines is also evident from double-digit increase in questionable claims (QC), referred to NICB, in the last four years. The rise was mainly driven by referral reason suspicious theft of vehicles.
Organized fraud is also high in personal line insurance.
As per NICB's report on Organized Group Activity, which stated 'personal automobile' as the policy type that reported the highest number of referrals (10,659 QCs out of 13,014 QCs were reviewed during the study period).
Fraudulent claims directly impact Loss Ratio, thereby, reducing profitability and also negatively impacting Return on Equity (ROE). As reflected in Exhibit 3, despite a fall in Expense Ratio, an elevated Loss Ratio pulled down ROE in 2014. During the same period,
a 1.8 pps (percentage points) increase in Loss Ratio also negatively impacted underwriting profits by 26 percent in 2014. Maintaining Combined Ratios below 100 is a pre-requisite for P&C insurers to post reasonable levels of profitability.
This emphasizes a strong need of loss management to control dishonest claims payout through better fraud detection techniques.
Fraudulent claims add to premium costs, since insurers are compelled to pass on the cost of such claims to policyholders. According to the WNS DecisionPoint™ survey, half of the respondents felt that fraud escalates premiums by three to five percent. Nearly a quarter of the respondents reported escalation to be over five percent; while the rest mentioned it to be between one and three percent. The cost of fraud added to the premiums varies across insurance lines and states, and is much higher for 'No-
Fault' states such as New York, Florida and New Jersey. These states have the highest auto premium prices, mainly caused by fake claims involving staged car accidents. Fraud is also primarily responsible for rapidly rising workers' compensation premiums, driven by false injury claims and misrepresentation of facts at the time of application.
However, given the competitive environment, increasing premiums to compensate for fraud losses is
no longer feasible for the insurer. This trend, combined with low investment yield (drop of 57 pps from 3.74 percent in 2011 to 3.17 percent in 2014)viii, has also impacted the profitability of the insurer. Given all this, insurers need to shift from traditional ways of detecting fraud and adopt advanced fraud detection and prevention techniques.
Shift In Fraud Detection Approach With Rise Of Analytics
Traditional approach of detecting fraud is still being used by few insurers in this era of complex and sophisticated crime. Some of the traditional methods are internal audits, red flag indicators, and scoring models, as explained in the illustration below.
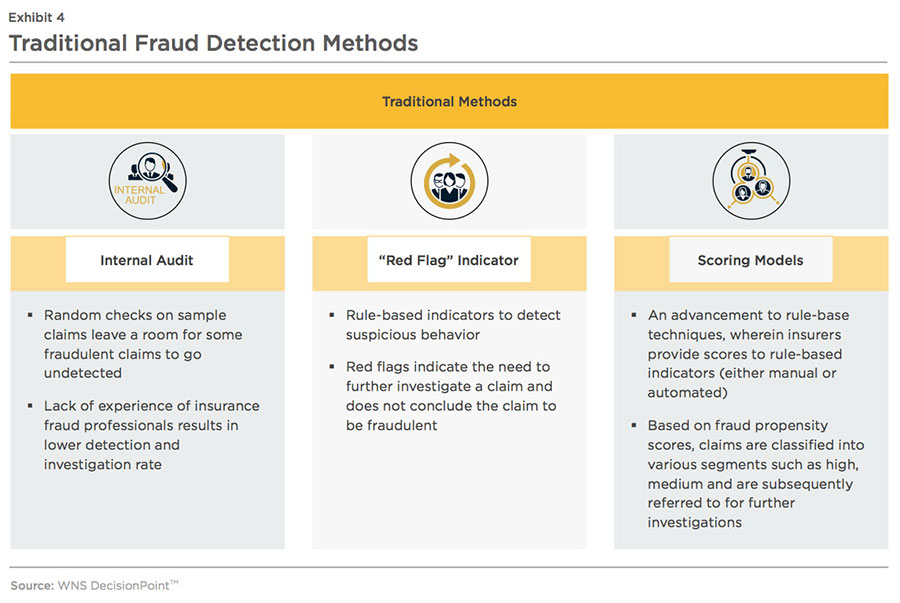
These traditional methods primarily detect known fraud patterns using sampling techniques. Since these methods require manual intervention, there is a higher possibility of human error and longer lead times from fraud detection to the settlement of claims. Traditional approaches are also known for high false-positive rates (flagging genuine claims as fraudulent), which impact customer satisfaction. Given the competitive environment with high customer switching rates, especially for auto insurance, low customer satisfaction adversely impacts customer retention. Despite these drawbacks, some P&C insurers in the U.S. still continue to use these traditional methods as they lack the expertise and infrastructure to deploy advanced analytical techniques.
AUTOMATED AND ANALYTICS-DRIVEN FRAUD IDENTIFICATION AND INVESTIGATION
Realizing the limitations of traditional methods, many carriers have started adopting anti-fraud technology to determine the likelihood of claims fraud. As per the survey report on 'Insurance fraud detection technology' conducted by Coalition Against Insurance Fraud (CAIF) and SAS Institute, the number of respondents using anti-fraud technology grew from 65 percent in 2012 to 71 percent in 2014ix.
Insurers are also increasingly adopting analytics to predict the
occurrence of fraudulent claims (notably in the case of catastrophes, which greatly magnify the scope for fraud), and to drive innovations in detecting organized activity early in the claims cycle.
The increasing adoption is reflected in increased investments in data analytics and modeling technologies by insurers. According to a survey of 42 insurers by CAIF and SAS Institute, 25 percent planned to increase investments in anti-fraud technology between
2014 and 2016ix. Investments in advanced solutions such as link analysis, predictive modeling and other sophisticated data analytics are expected to increase and insurers will partner with specialist service providers to drive down fraud-related expenses. This helps insurance companies quickly and accurately determine whether a claim needs further investigation and to determine the complexity of the claim.
How Fraud Analytics Add Value at Each Stage of the Policy Life Cycle?
Fraud can be detected across the four stages of the policy life cycle as mentioned below. Fraud analytics, if deployed at various stages of the policy life cycle,
enable insurers to have a comprehensive view of each policyholder, which paves the way to discover organized frauds.
Point of Sale (POS)/Renewal Stage
Since a sizable part of claims fraud is initiated at the application stage, it is very important for insurance
companies to put a check on the underwriting fraud to decrease premium leakage and avoid
exposure to known fraud at the claims stage.
Apart from the traditional Red Flag indicator method, many insurers are using a combination of business rules and analytics to tackle underwriting fraud. According to the WNS
DecisionPoin™ survey, all respondents deployed predictive modeling techniques at the underwriting stage to enhance understanding of current and future insured risks, as seen in
Exhibit 8. As a result, insurers were able to develop premiums that accurately reflected the relative risk characteristics of the pool of underlying policyholders.
After implementing analytics at the point of sale stage, most of the carriers were able to promptly
detect fraudulent policies and exercise better control over business rules indicators. This
section of insurers also experienced lower claims volumes and additional benefits as shown below.
Claims Stage
At the FNOL stage, the role of claims handler is very important as they are responsible for processing and investigating insurance claims relating to customers' policies. Thus, the inability of claims handlers to accurately notice doubtful patterns results in fake claims getting paid. The chart below illustrates important role of analytics in the fraud detection process at the claims stage, investigation stage, and post- claims stage.
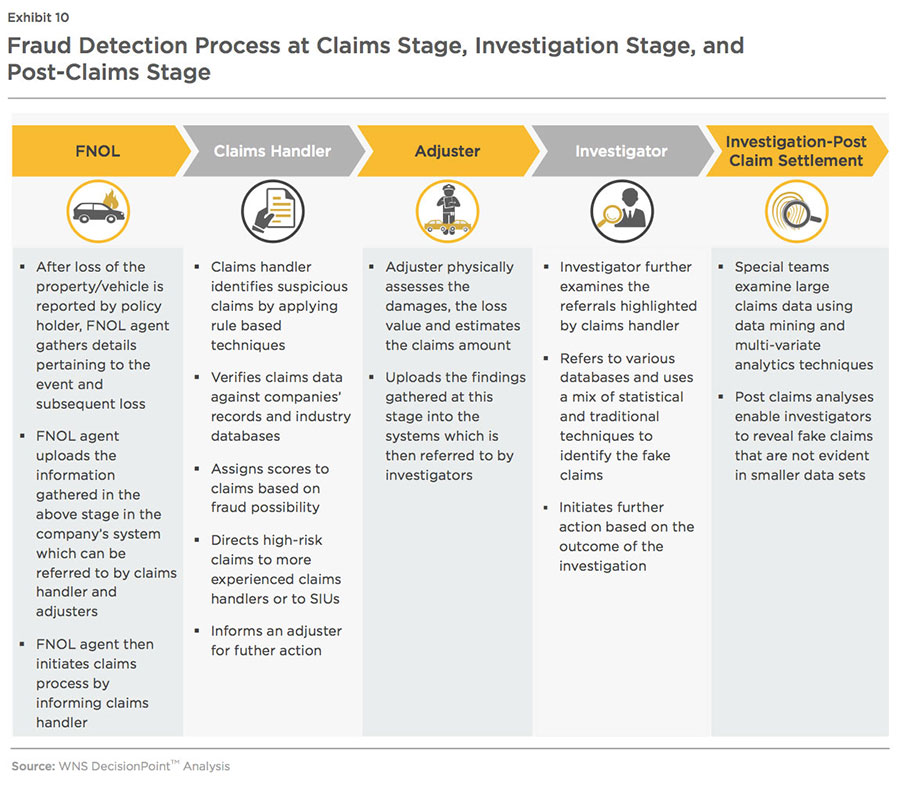
Most claims handlers assess claims
using a set of specified indicators and then verify submitted details with the data generated from internal systems of record (log book, policy data, and customer records) and external data sources (NICB, Insurance Services Office (ISO)7 Claims Search, among others). It is very important to provide accurate and recent information/data to claims handlers as analysis of incorrect or outdated information results in undisclosed dishonest claims and also generates high false positive rate, which overburdens the Special Investigative Unit (SIU).
In order to validate a larger number of claims in a shorter period of time with higher accuracy, claim handlers are required to use sophisticated analytics. This, in turn, results in the identification of low-fraud incidence events (with probability as low as 0.001 percent). Some analytics techniques, such as predictive modeling, enable insurers to categorize risks and derive fraud propensity scores in real time, which helps claims handlers adjust their line of questioning and route suspicious claims to investigators. Analytics solutions, such as reporting and visualizations of data patterns, also help insurers easily understand the impact of ongoing fraud analysis on their business.
As per the survey conducted by WNS DecisionPoint™, insurers using analytics reported higher benefits compared to the insurers, who are using traditional methods or automated indicators
(see Exhibit 11).
Investigation Stage
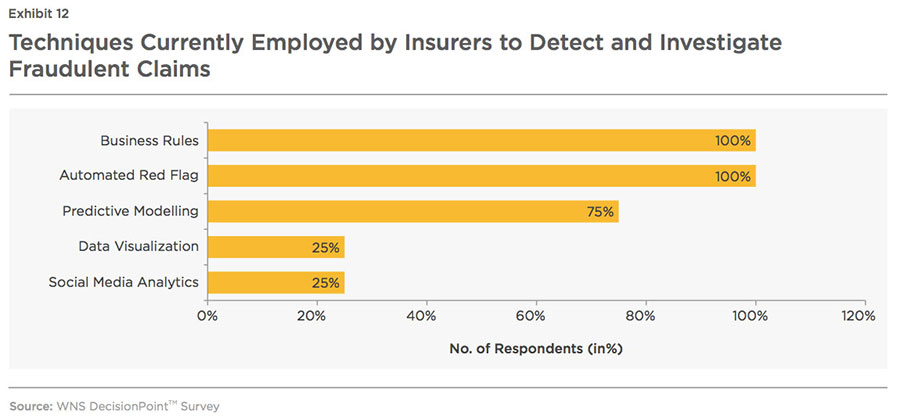
Within the claims life cycle, analytics is largely used at the investigation stage. At this stage, investigators scrutinize each claim referred to by claims handlers. They compare claims' data against various data sources (such as policy information, claim history, medical reports, NICB, ISO, among others) to check the veracity of the information provided by claimant. Analytics play an important role in collecting, consolidating and integrating scattered data from various data sources. Techniques such as social network analytics enable investigators to quickly uncover linkage of claimants with fraudulent activities, thereby, decreasing the amount of time taken to expose hidden relationships among entities and potential fraud. However, owing to lack of in-house expertise, extensible and scalable information foundation and technology systems, adoption of analytics by the U.S. based P&C insurers is low and they usually rely on automated red flags and business rules to determine fake claims. Further, only
predictive analytics is being deployed at investigation stage to improve fraud detection and speed up claims processing, indicating underuse of other solutions, as shown in the chart below.
Post-Claims Stage
Application of fraud analytics at the post-claims stage is in a nascent phase and is mostly deployed by players with P&C revenues over $5 billion. Few insurers employ a special team within their SIU, who specially look into claims after their settlement. This team analyzes enormous volumes of claims data to determine patterns of fraud, which surface gradually and are difficult
to trace in individual claims investigations. This is more common in the No-fault States, where insurers are required to make faster settlements and do not have enough time to scrutinize claims thoroughly.
At this stage, the SIU analysts compare large volumes of claims data using multiple techniques and tools (such as combinations of
business rules, automated red flags, predictive modeling, and text mining, among others) to uncover unrevealed inter-relationships between claims and other entities 8 involved in such activities. These insights enable insurers to discover organized fraud, and also to continuously improve the rules and models operating at the POS, FNOL, and Investigation stages.
BIG DATA FRAUD ANALYTICS
Fraud analytics has evolved from building models and providing fraud scores to policies and claims, to enabling real-time fraud detection by efficiently and effectively processing the deluge of structured and unstructured data that is available within and outside the company.
Insurers mostly analyze structured and unstructured data, which represents just 15-20 percent of the total data that is generated by insurance organizations and is mostly historical in naturex. It is to be noted that analysis is based on historical data tends to lose its predictive power beyond a certain point.
In the current environment, where fraud rings adopt sophisticated techniques, real-time data availability is crucial to increase accuracy. Analysis of internal and external unstructured data provides a great opportunity to uncover complex fraudulent activities, which are difficult to trace through analysis of the structured data. For instance:
- Scanning through social media interactions of a claimant may reveal his visit to a bar before his car accident
- Applying analytics on claimant's social network data may reveal his connection with entities who are/were involved in fraudulent activities
- Log notes and web interactions can confirm claimant's urgency for claim settlement, adjustor's notes may point out inflated vehicle repairs
Such a multi-pronged, coordinated approach to fraud can be used for comprehensive risk shrinkage by altering fraud detection policies/rules at underwriting stage and also save on promotional costs by avoiding marketing to such 'potential high-risk' prospective customers. Apart from disclosing hidden fraudulent activities, unstructured data analysis also enables insurers realize many benefits in terms of efficient processes and reduced costs.
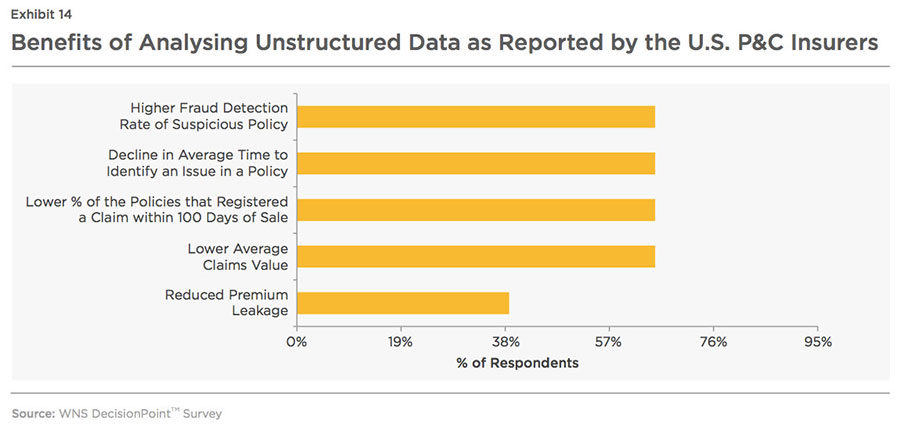
Benefits accrued from the assessment and evaluation of unstructured data have encouraged insurers to invest more on tools and techniques to examine Big Data (notably social media posts) to flag claims for closer inspection, priority handling and settlement. However, use of unstructured Big Data such as e-mails, blogs, web interaction, audio/video, and images, is still at a nascent stage. Predictive analysis, on the other hand, uses a combination of rules, modeling, text mining, database searches and exception reporting as mentioned in the charts below.
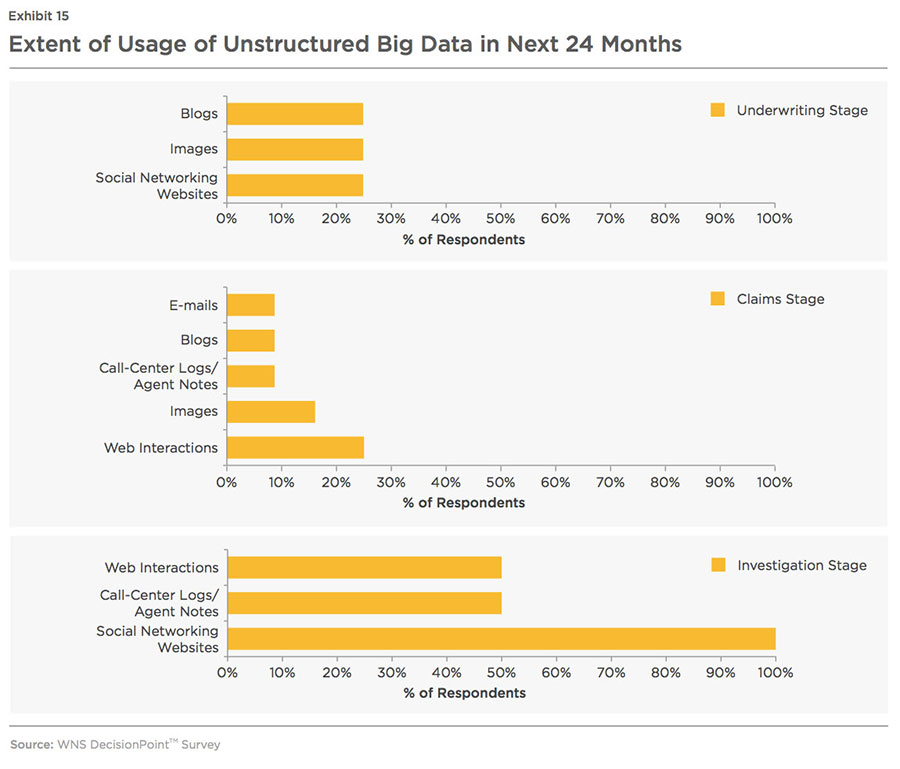
Big data is scattered within and outside the organization and is in an unstructured form, which makes it very difficult for an insurer to gain meaningful insights. Insurers are required to possess robust data management capabilities to be able to cleanse and integrate the external data with internal data and obtain a complete view of the policy holder, claimant, and his/her actions. Thus, very few insurers are able to analyze unstructured data owing to technology inadequacies and a lack of in-house expertise in this area.
Building an Environment to Support the Use of Big Data Analytics
- The data (structured, semi- structured and unstructured) collected from various sources are fed into the data collection tool.
- The data is then cleansed, to be loaded into a data warehouse. The semi-structured data, as sourced from ISO and NICA reports, is reconstructed into the structure appropriate for running predictive models. Unstructured data sourced from log notes, e-mails, adjuster's notes, among others, may not be in English and may contain fragments of sentences, acronyms, copy and pasted e-mails, images, typos, misspellings, etc. This data is also transformed and loaded into the data warehouse.
- The analytics team uses the information stored in the data warehouse and combines that information into analytics models to generate fraud scores based on multiple factors. The information used includes previous sentences, associations with other people with past fraud cases, multiple rejected claims, and modifications to personal information.
- Techniques such as predictive modeling, social media analysis, and social network analysis, are integrated into the fraud identification modeling process, which further modifies the scores based on the output from these techniques.
- The alerts generated by analytics models are further investigated and evidence collected from this model is added to the existing system to further build the case.
Role of Big Data Analytics at Various Stages of the Policy Lifecycle
It is very crucial for insurers to implement Big Data analytics at all three stages of the policy life cycle to develop an end-to-end, comprehensive fraud management programme.
Benefits Generated by Insurers who Deployed Big Data Analytics
Although challenging, analyzing Big Data enables insurers to understand unknown correlations much earlier in the policy life cycle and to develop a deeper understanding of emerging suspicious patterns or risks. Insurers adopting Big Data analytics reported 40 percent improvement in the average referral time, 50 percent more average referrals, 2.5x reduction in average investigation time and 1.4x lower average investigation costs compared to insurers, who have not deployed such sophisticated statistical techniques
(see Exhibit 16).
Adoption of Big Data analytics at the investigation stage also enables insurer to gain similar benefits in terms of cost and time. The average investigation cost of insurers, who use Big Data analytics, was 67 percent lower, and the average time per claim investigation was 2x shorter, compared to the other insurers. Insurers also reported other benefits as shown in the graph below.
Low Adoption of Big Data Analytics
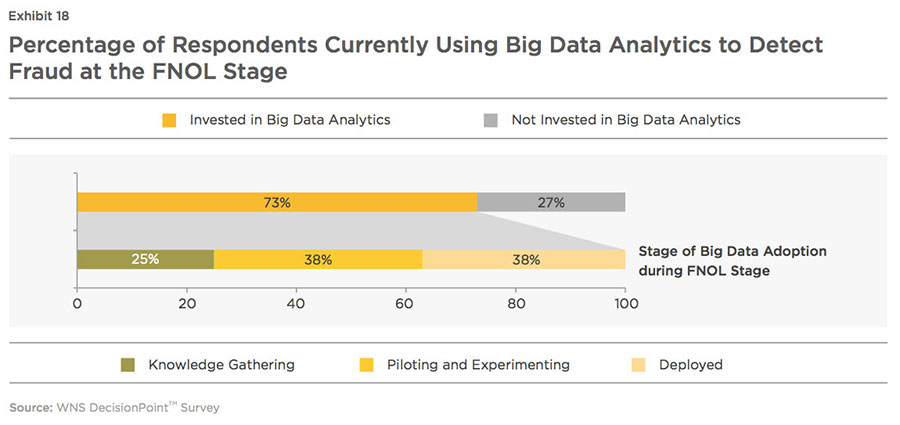
The adoption rate of Big Data analytics is very low across the policy life cycle. This is especially true at the underwriting stage, where only one-fourth of respondents have only invested in Big Data analytics and are still at a knowledge gathering stage.
At the claims handling stage, although 73 percent of the
respondents have invested in
Big Data analytics, complete deployment is accomplished by only a few of them, and most insurers are either in the pilot stage or at a knowledge gathering stage (see Exhibit 18). Insurers are reluctant to invest in such projects, as the practical challenge of defining ROI from such investments remains. They also face capital crunch for funding such projects and have infrastructure constraints to support Big Data application requirements, tool capabilities, and best practices for implementation. Adoption of Big Data analytics at the investigation stage is moderate with near to 50 percent deployment rate.
However, increasing confidence in Big Data analytics is driving a large number of insurers to invest in utilizing new sources of data that extend beyond traditional and internal sources. As per WNS DecisionPoint™ survey, around 33 percent of the underwriters, who have not leveraged Big Data techniques, are planning to make such investments in the next year and the rest, within a period of two years. Most of the claims handlers and investigators, who have not invested, are also planning to deploy Big Data technologies within two years.
Challenges in Adopting Big Data Analytics
The challenges across the various stages of Big Data implementation need to be clearly understood and addressed to ensure the maximum chance of success. Big Data adoption is broken into four phases: Planning, Knowledge Gathering, Pilot, and Full-scale Deployment.
Insurers, at different phases in the Big Data adoption, face different problems (as stated in the above diagram) and require appropriate solutions, which will not only enable them to reach the deployment phase sooner, but also maintain and enhance the processes, thereafter.
- Insurers at planning phase:
At this stage, while insurers face many issues, their main concern is determining the decision- support value of Big Data, as reported by 75 percent of the respondents. Nearly a quarter of the respondents struggle to understand the definition and use of Big Data and the analytics capabilities required to enhance decision-making speed and effectiveness. These insurers should:
- Ensure that Big Data strategies are aligned with business objectives
- Conduct stakeholder communication/education sessions to articulate the business value of Big Data in improving the fraud management processes. Some of the benefits accrued to the insurer include increased true positive referral rate, early forewarning of suspicious behavior, reduced average cost of investigation per claim, and shortened claim investigation time by SIU analyst, among others
- Insurers at a knowledge gathering phase should:
- Explore the volume and variety of unused data within and outside the organization, optimize the usage of internal and external data and accordingly, assess the organizational, information management and technological changes needed to embrace Big Data
- Understand the requirements of tools and techniques to manage and glean relevant insights from big data sources, application of statistical and predictive analysis techniques, best practices and organizational change readiness
- Make sure that all data points, captured from various internal and external sources, are integrated into the company's system to provide a unified view of policies/claims across the underwriting department, the claims department and the investigation department. If internal IT systems are fragmented and not geared to handle Big Data, the project will fail to produce desired outcomes
- At the pilot stage, insurers should:
- Ensure that various departments are ready for the pilot or proof of concept run
- Ensure close coordination between the various departments including SIU, claims, underwriting and IT to jointly determine Big Data implementation blueprint
- Classify the business units as owners and implementers to provide clarity regarding roles and responsibilities of each participant
- Evaluate the gap between estimated and actual benefits derived from usage of Big Data analytics
- Document lessons learned from implementation failures and use that during the planning and design of the next pilot
- Insurers, who have already deployed Big Data analytics should:
- Train SIU analyst and investigator resources to institutionalize the usage of Big Data analytics
- Modify or update red flag rules and reframe fraud detection and prevention strategies, whenever a new fraudulent pattern is discovered
- Continue to explore the untapped data existing within the organization and external data to promote higher and accurate fraud detection and prevention
Insurers, who are thinking of adopting these techniques and the underpinning technologies in the near future, can consider enlisting the services of a specialist analytics service provider in order to share the significant investments required in such projects and acquire the right skills and domain expertise in the shortest period of time.
The Keys To Successful Big Data Adoption
For robust fraud management practices, a comprehensive framework is required, which scans all possible areas of fraud in the policy life cycle, in a unified manner. Below are the emerging best practices to successfully operationalize Big Data analytics.
- Build a dedicated fraud management team to coordinate fraud detection processes of various departments
- Evaluate prevailing fraud detection system(s) and identify gaps, if the system is not aligned with the organizational objectives.
- Recognize the skill sets required to implement Big Data analytics and accordingly, decide whether to build the analytics solutions in-house or partner with external vendors. If the decision is to use an external vendor, evaluate different vendors to find the solution that best aligns with the company's requirements.
- Ensure all the data points from the various departments involved in fraud detection process are integrated in a unified policy/claim view.
- Reframe the prevailing business rules by leveraging domain expertise and set realistic threshold values for different anomalies.
- Use a combination of different detection techniques to improve the efficiency of fraud management process. For instance, business rules and anomalies detection can be applied to all claims to identify discrepancies in data or to find those claims that exceed the anomaly threshold limit. The screened claims then can be filtered by running predictive models which assign a fraud propensity score to each claim.
- Integrate social media analytics and social network analytics with predictive modeling to uncover evidence of fraudulent activities.
- Continue to explore untapped data and integrate such data points into existing fraud detection system.
Since their creation, P&C insurance companies have been battling fraudulent policies and claims. Currently, this fraud can increase claims expenses by up to a staggering 20 percent. As schemes for committing fraud proliferate, traditional fraud detection techniques are becoming less and less effective. Automated rules have helped, but they are inefficient and ultimately not the best available solutions. The future is clear. Big Data analytics offers underwriters, claims handlers, and investigators an advanced and statistically reliable solution to revolutionize their fraud management processes. Adoption of Big Data analytics may be challenging, but the end result is worth it.
References:
i. Report by SAS, Plugging Premium Leakage, 2013
ii. Report by Economic Policy Institute, EPI Briefing Paper on (In)Dependent Contractor Misclassification, 2015
iii. Survey by FICO, The three best targets for attacking P&C insurance fraud, 2010,
iv. Report by NICB, First 3 Quarters of 2011, 2012, 2013 Questionable Claim Referral Reason Analysis, 2013, Author - David Fennig, Strategic Analyst
v. Report by NICB, Organized Group Activity in Insurance Fraud, 2012, Author - Andrea McLain, Strategic Analyst - Andrea McLain, Strategic Analyst
vi. WNS DecisionPoint estimates based on the report by National Association of Insurance Commissioners (NAIC), Profitability by line by state, 2014
vii. Report by Insurance Research Council, Insurance Research Council Finds That Fraud and Buildup Add Up to $7.7 Billion in Excess Payments for Auto Injury Claims, 2015
viii. Report by NAIC, Insurance Industry Snapshots, 2014
ix. Report by SAS and Coalition Against Insurance Fraud, The State of Insurance Fraud Technology, 2014
x. Report by Coalition Against Insurance Fraud, Journal of Insurance Fraud in America, 2015, Author - James Ruotolo, Principal for Insurance Fraud Analytics at SAS.