Companies primarily reward their shareholders in two primary ways dividend payments and stock repurchases. These payouts are important to keep the share prices buoyant because growth opportunities (another share price driver) are limited in the physical retail sector due to high maturity and saturation. Buybacks, often at indiscriminate prices, are used to demonstrate to the Street that the stock is undervalued, while stocks with high dividend yield attract risk-averse investors when bond yields are low. To analyze these payouts and the corresponding funding required to support them (Exhibit 1), WNS DecisionPoint™ studied the data of the top 147 retailers (by revenue) in North America and Europe. Our findings show that the payouts have grown by 3.1 percent annually during the last five years dividend payments grew by 5 percent and repurchases 1.8 percent.
The main challenge for retailers lies in funding these distributions. The two internal sources for funding these payouts are net income and cash from operations. While the growth in net income has not matched the pace of growth in payouts (2 percent per annum), cash from operations grew by 3.8 percent yearly, helping the retailers fund the payouts. We also found that three out of five times, spending on dividend payments and repurchases by retailers has exceeded the net income. Hence, it is critical for retailers to improve their working capital1 management to generate a positive impact on the cash flow.
Another metric that helps us understand the importance of working capital management is the capacity of cash flow from operations, after provisioning for Capital Expenditure (CapEx), to fund payouts (Exhibit 2). This metric is important as retailers face several challenges driven by the shift in consumer's discretionary spending and a rapidly evolving omni-channel ecosystem. Analysis of monthly retail trade statistics by both the U.S. Census Bureau and the U.K. Office for National Statistics demonstrates flat salesi growth (year-on-year) for the period between October 2015 and September 2016. This is a result of deep-discounting in response to e-tailers such as Amazon that eat into the traditional retail market share and erode the margins of brick-and-mortar stores. To fend off competition from e-tailers, physical retailers are pursuing omni-channel strategies and hence need to provide for sufficient CapEx in IT, supply chain and stores.
While Exhibit 2 paints a rosy picture and tells us that the top retailers are comfortably placed, a closer look reveals that cash outflows for dividends and buybacks in more than 40 percent of retailers have exceeded the cash flow from operations after CapEx. These retailers have particularly relied on debt financing to fund payouts (after CapEx), with their debt to equity ratio increasing remarkably from a combined 49.8 percent in 2012 to 82.2 percent in 2016. These companies might have taken advantage of a recovering economy and a generous credit market to enhance both dividends and buybacks. However, with the Federal Reserve expected to increase the rates soon, the cost of funds will be higher, and depending on the credit market, to cover the cash flow deficit may not yield the desired results. Raising equity could also be an option to fund the payouts; however, the cost of capital could go up again, and exert downward pressure on share prices. Hence, it would be desirable for companies to have a robust working capital management strategy to bridge their cash flow deficit in relation to investor payouts.
Retailers need to monitor and benchmark their working capital levels as it enables them to assess their performance relative to their peers and also incorporate best practices. However, retailers should decide on how aggressively they want to focus on working capital management by carefully weighing the risks associated with such initiatives on key functions (product quality, compliance, customer service and supply chain management). This leads to well- informed and balanced decisions, with minimal disruptive impact to the business.
WNS DecisionPoint™ analyzed the working capital performance of 147 publicly listed retailers in North America and Europe, across nine
global categories (retail sectors), from 2012 to 20162. Our analysis shows that retailers have been unable to make sustainable
improvements in their performance, as there is a performance decline of +0.25 days in the five-year timespan (Exhibit 3).
Category level analysis reveals the variation in terms of performance improvement/decline over the last five years, and the mean actual length of working capital cycle or Cash Conversion Cycle (CCC)3. (Exhibit 4). Categories such as apparel, drug retail, food, hypermarkets, supercenters and general merchandise stores have registered significant improvements over the period of analysis (2012- 2016). However, categories such as electronics, home improvement and furnishings, and specialty stores have witnessed significant increase in their days' working capital. The conversion cycle is also driven by the specific products that the retailers sell. For example, food retailers mostly sell perishable products, leading to higher inventory turns and negative CCC. This is reflected in our analysis as more than 50 percent of food retailers in our study have negative CCC.
Specialty retail, on the other end, comprises of retailers selling diverse products such as office supplies, fine art and jewelry. For most fine art and jewelry retailers, inventory is in the form of luxury products marked by low purchase frequencies and long buying cycles. As consumer dollars shift from retail products to experiential spending, the fall in purchases and the lengthening of the buying cycle has become even more prominentii. We will examine trends for each sector in more detail in the 'Sectoral Analysis' section.
Retail Working Capital: Improvement Levers & Financial Impact
In any industry, the working capital performance has a high degree of variability across sectors, and also for companies within the same sector as well. The aim of this analysis, based on the latest annual data for last five years, is to establish benchmarks for finance executives in the following areas:
- Structural variances in CCC across different sectors and its cash flow implications
- Guidelines for developing a prudent working capital management strategy
Sectoral Analysis
WNS DecisionPoint™ analyzed the structure of CCC for all the nine retail sectors (listed in Exhibit 4). The retail industry operates on minimal credit, as a majority of the transactions involve payment at the point of sale. Perhaps, this explains the significantly lower contribution of Days Sales Outstanding (DSO) to the overall CCC. Drug retail and electronics' stores are the only major exceptions to this trend (Exhibit 5).
On the other hand, inventory days or Days Inventory Outstanding (DIO) is the single largest and most important component of CCC for almost all major sectors, food retail being the only exception as retailers in this sector have significant leverage in deciding payment terms with their suppliers. This market characteristic enables them to negotiate better credit terms with their suppliers which explains the exceptionally high value of Days Payable Outstanding (DPO) for these companies. Hence, for a finance executive in the retail industry (excluding retail pharmaceuticals and electronics), it makes sense to focus on either inventories or payables when making process optimization investments. To comprehend the financial impact associated with improvements in working capital position, WNS DecisionPoint™ developed a Business Impact Quantification (BIQ) framework which links unit factor (one-day) improvement in specific components of CCC - DSO, DIO and DPO to favorable business outcomes and estimated potential gains. This analysis enabled us to identify the scope for substantial improvement for lagging performers in each of the nine sectors (Exhibit 6).
Apparel Retail: While the average CCC for this sector stands at 56.8 days, underperformers have an average CCC of 90.7 days. A bulk of the improvement in CCC can be driven by better inventory management practices, which will optimize the inventory carrying costs for these retailers and enable them to resist heavy discounting from online peers. Based on the unit factor improvement across all three components, i.e., receivable days, inventory days and payables days, we see potential improvements translating to an additional cash flow of ~USD 213.7 million for apparel retailers.
Department Stores: Department stores have seen a particularly abrupt rise in their CCC in the last one year. Our analysis demonstrates that an all-time high 70 percent of department store retailers have seen their CCC lengthen in the last fiscal year. This is primarily driven by a pile-up of inventory due to errors in merchandising and assortment decision-making as the DIO has increased substantiallyiii. Hence, our estimates highlight that there is potential for gradual improvement of 20 days in CCC, with one-day improvement in days' inventory translating to USD 134.9 million of additional cash flow.
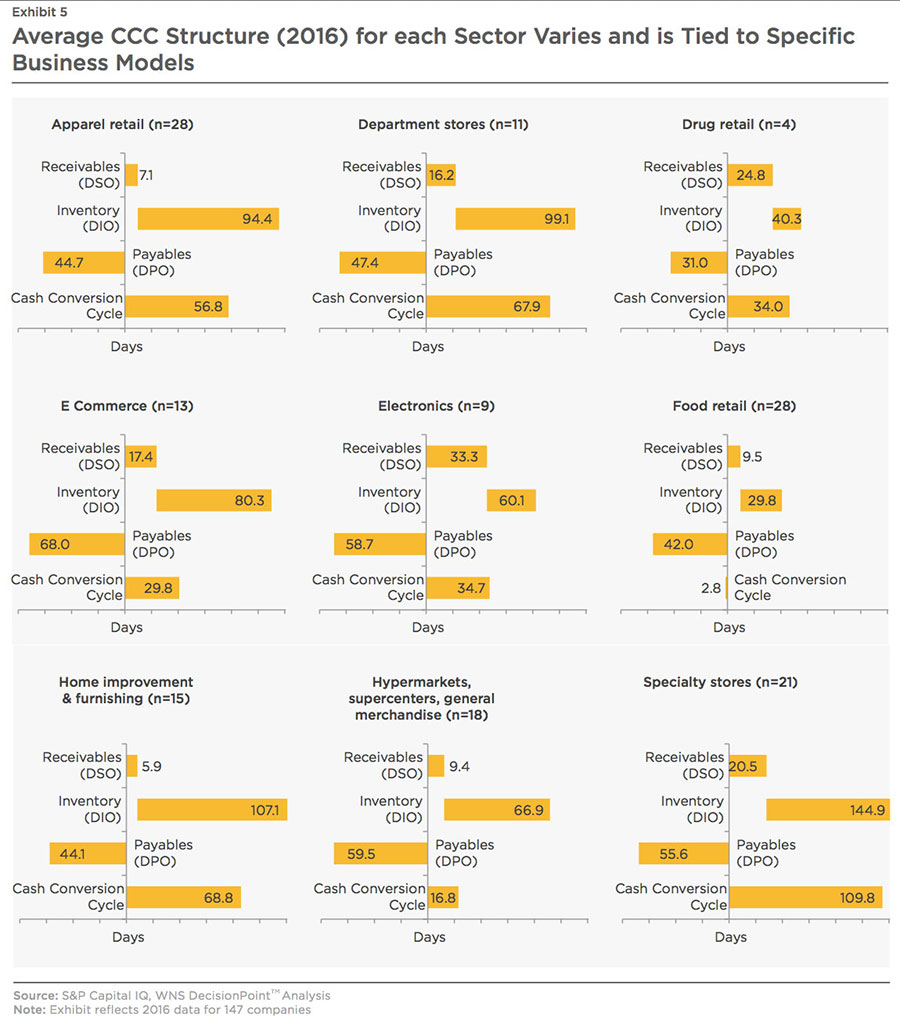
Drug Retail: Based on our estimates, underperforming drug retailers have the potential to improve their CCC by 8.3 days, with improvement in supplier payment terms alone saving ~8 days. Improving supplier terms and consolidating supplier relationships will yield ~USD 430 million in additional cash. Additionally, there is room for efficient monitoring and reassessment of suppliers on a frequent basis, given the oligopolistic nature of this sector.
E-commerce: Our analysis reveals a marked polarization in working capital performance among e-tailers. At one end of the spectrum are diversified e-tailers such as Amazon that have negative CCC and are highly efficient in managing their inventory. On the other hand, there are specialist e-tailers whose CCC has lengthened as they struggle to manage inventory with weakening consumer demand, leading to deteriorating working capital performance. At a structural level, the difference arises mainly due to the difference in DIO, which is 35.5 days for diversified e-tailers as against 118.8 days for specialist e-tailers. Diversified retailers such as Amazon are highly skewed towards an inventory-light marketplace model which is one of the key drivers for lower DIO. Additionally, Amazon has invested in technology systems that enable dynamic pricing based on factors such as demand and price elasticity. Thus, analytics driven decision making is embedded in both the assortment strategy and the supply chain orientation giving the company significant edge in the current retail landscapeiv. Hence, specialist retailers such as Land's End are entering into tie-ups with e-tail giantsv to improve inventory turns and reduce the current gap in average CCC which stands at 56 days.
Electronics: The average CCC of this sector is 34.7 days, while that of the top performer is -46 days. While electronics' retailers are able to leverage better payment terms with suppliers vs. other sectors, there is scope for below average performers in this sector (n=2) to unlock USD 6.5 million in additional cash based on improvements in supplier terms by one-day. With e-tailers eating into their market share, companies in this sector are seeing a reduction in sales growth. Therefore, majority of them have already taken steps to reduce working capital requirements.
Food Retail: While the sector posted an impressive overall negative CCC of -2.8 days, performance is concentrated along the two extremes of the continuum. Our analysis demonstrates that below average performers have significantly higher CCC at ~14 days, compared to ~-19 days for above average performers. As these retailers hyper localize their assortments, they will have to reassess their supplier strategy. This calls for food retailers to evolve their supplier market intelligence practices and enable more prudent decision making on a sustainable basis. Additionally, most of the larger players in this sector have the scope for optimizing their supply side transaction processes significantly, given the wide differences in average length of the payables cycle between average and below average performers. Our analysis further shows that these supply side initiatives will generate ~USD 530 million in additional savings for food retailers based on one-day improvement in days' payables for below average performers. At 58 percent of total savings, this is the highest among all sectors.
Home Improvement and Furnishings: Average CCC of the sector is ~69 days. Our analysis shows that inventory is the key lever to drive additional cash flow of ~USD 33 million based on one- day improvement in DIO, as below par performers can improve their inventory turns by as many as ~32 days on an average. Hence, finance executives in this sector will be well-served to focus on their inventory management operations and realize amplified benefits in their cash position. As an example, companies can learn from the improvements made by Home Depot. The Atlanta-based retailer embarked on a supply chain transformation project in early 2014 and has realized improvements in its inventory turnover from 3.8x to 4.8x over the last five years vi. Senior executives in the company have identified clear outcomes with an explicit focus on reduction in days' inventory while maintaining appropriate stock levels in-storevii. A key aspect has been the reconfiguration of the supply chain to provide an aggregated and synchronized view of inventory information across all channels. Additionally, Home Depot has developed Rapid Deployment Centers (RDCs) enabling them to serve 90 percent of orders in the U.S. within two days. A key learning here is that Home Depot's executives are still pursuing further improvements and are targeting inventory turnover of 5.7x based on both operational and technology investments in their supply chainviii.
Hypermarket and General Merchandise Stores: This sector consists of some of the largest big- box/general merchandise retailers. Our analysis reveals a wide performance gap in companies' working capital performance; with average CCC of the sector being ~17 days, as compared to 62 days for under performers and -12 days for out performers. Further study highlights that the variation is driven by two distinct industry characteristics. Most of the above average performers are large big- box retailers who have significant leverage over their suppliers, enabling favorable terms of payment and deliveryix. Operationally, these big-box retailers are able to outsource most of the risks, as the cost and ownership of missed deliveries and stock outs fall on suppliers. By contrast, most of the below average performers operate deep- discount formats such as dollar stores. The suppliers mostly sell excess inventory as a last resort to clear their warehouses. This, in conjunction with the discount oriented business model, leaves these formats with less scope to negotiate more favorable terms with suppliers. Additionally, big- box retailers are able to make significant investments to improve and optimize their inventory management processes. For instance, Target is focusing on new generation, cloud-based supply chain tools and RFID tagging for each item to improve inventory accuracy for store-level omni- channel fulfillmentx. Similarly, Walmart is testing drones in its distribution centers and has deployed an app that provides real- time information to associates on Stock Keeping Unit (SKU) availability in its warehousesxi, xii. This also explains the disparity in performance with respect to DIO which is an average of 45.2 days for top performers compared to 101.2 days for the under performers.
Specialty Stores:As mentioned, jewelry and fine arts retail stores are major sub-sectors within specialty retail. Hence, the average CCC of this sector is ~110 days, with cash being tied to inventory for ~145 days. Additionally, our analysis demonstrates that the working capital performance has deteriorated by 11.1 percent between 2012 and 2016.
Sustaining Gains And Avoiding Fallback
One of the objectives of our 2016 study is to identify companies that delivered outstanding working capital performance on a sequential basis. Our analysis shows that 16 out of 147 companies (11 percent) continuously improved their working capital performance over a three-year period. Only nine companies that make up 6 percent of the sample set improved their performance over all the four-years.
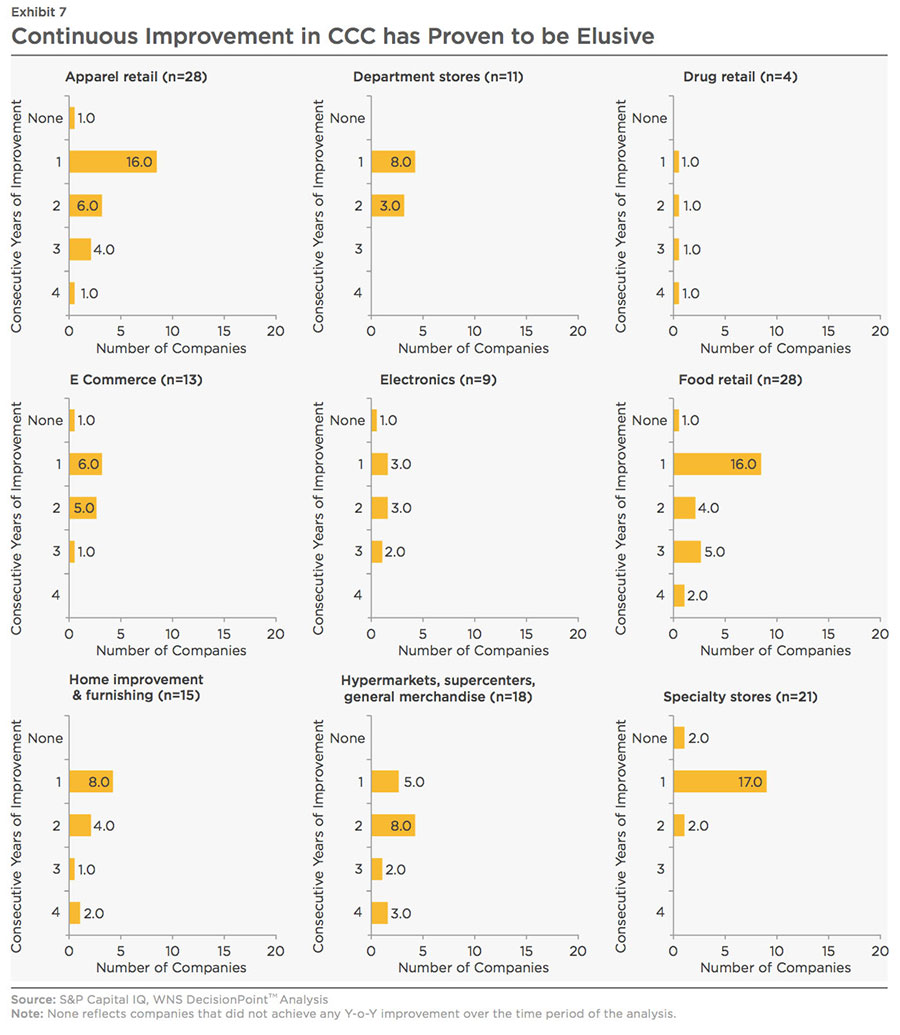
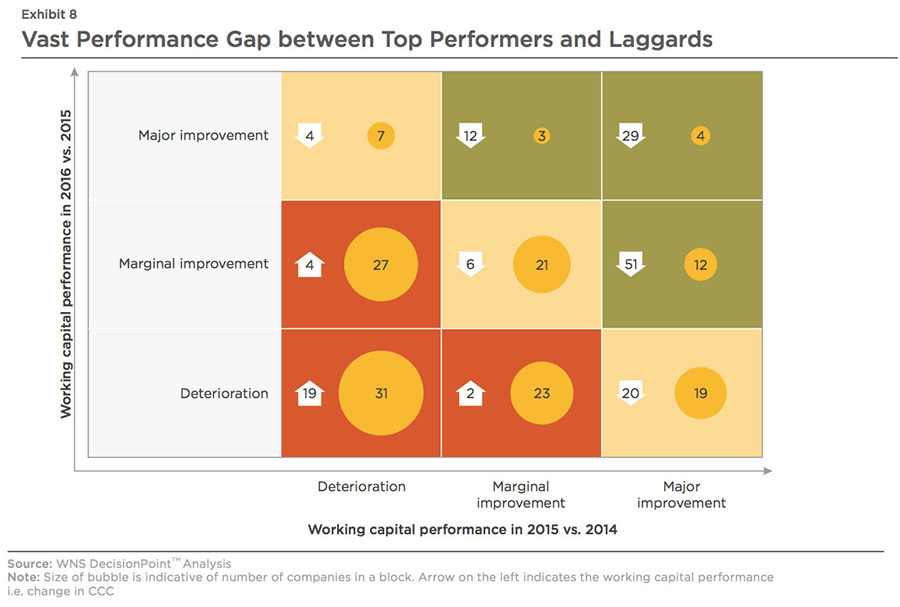
Most companies, across sectors, witnessed growth for a single year (54 percent), indicating a difficulty in sustaining and consolidating gains in working capital performance. Our analysis demonstrates that 13 percent of companies were able to register continuous improvements from 2012 to 2016. These companies, on an average, reduced their CCC by 31 days. On the contrary, the working capital performance of ~55 percent retail companies have deteriorated (Exhibit 7). Marked deterioration was seen among the bottom 21 percent (31 companies out of 147), as their CCC lengthened by 19 days from 2014 to 2016. Average performers (the yellow blocks in Exhibit 8) were midway between these two extremes, as they reduced their working capital by 10 days over the analysis period.
Standalone one-time initiatives, like an inventory due diligence exercise with a service provider, may provide windfall benefits. British retailer Tesco improved its working capital by GBP 400 million after shrinking its shelf inventory based on purchase trends starting early 2014xiii. This allowed the retailer to invest in categories with higher purchase value, driving 0.9 percent increase in comparable store sales.
In essence, inventory optimization has to be integrated with the supply chain design, best understood by retailers who saw major improvements in CCC during 2014-2015, and subsequent deterioration in 2015-2016. These retailers generated the highest reduction for the first year and improved their CCC by 32 days. However, their CCC increased by 12 days in the subsequent year as windfall gains of the standalone exercise had already been realized.
In a similar vein, retailers should reduce payables based on real-time supplier performance and evaluation. While supplier consolidation leads to improvements in payment terms and quick gains, developing a comprehensive supplier market competitive intelligence goes a long way in making the gains sustainable.
WCM Playbook: Identifying Value Enablers
Finance executives are often unable to deploy a sustainable strategy to improve working capital performance despite knowledge of the appropriate levers to do the same. Another challenge is linking the improvement in cash flow position to profitability. WNS DecisionPoint™ conducted statistical tests on the relationship between profitability and cash flow of the 147 companies. We found that for the entire time period of the analysis, profitability was significantly correlated to reduction in CCC. We also found, based on academic sourcesxiv, that the Return on Invested Capital (ROIC) is an equally key determinant of profitability as it captures changes in cash flow due to working capital improvements. Hence, we have identified the association levels of liquidity metrics with both profitability and ROIC.
We identified the association patterns between the three levers (receivables, inventory, and payables), and the working capital position based on statistical models for each sector. Our analysis reveals that the association levels vary by sector. But this only provides insight into the cause-effect relationship between these levers and cash position for each sector. There is also a need to identify additional cash flow for companies based on a day's improvement in these levers. Thus, we have categorized the financial impact based on the contribution of cash flow generated by the specific levers to the overall projected cash flow savings (Exhibit 9).
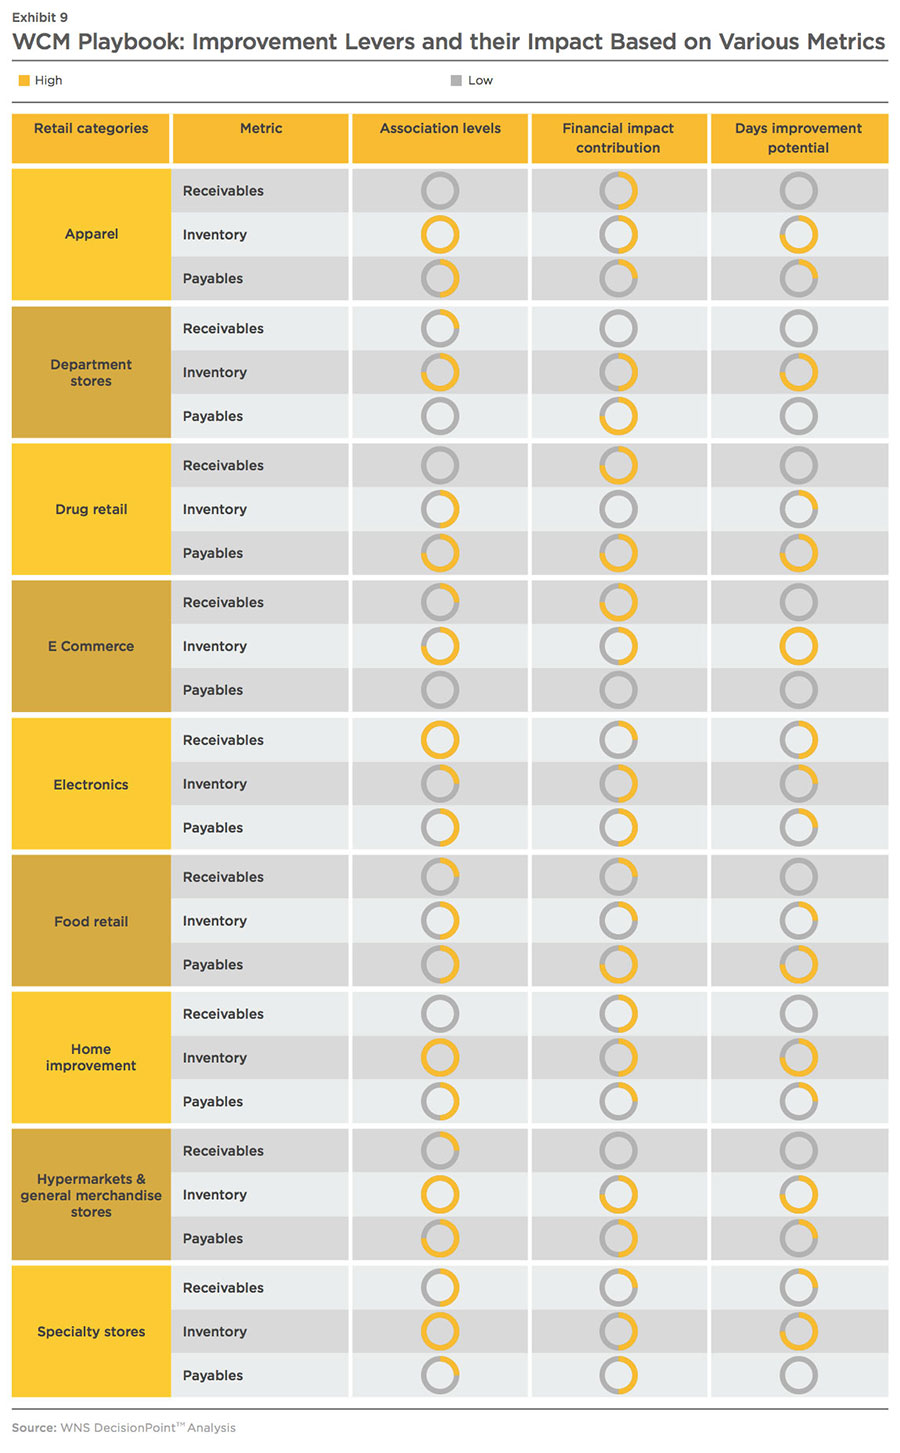
While we are discussing a day's improvement in additional free cash flow, in reality, the CCC levers may demonstrate a higher degree of improvement; however, this is not consistent across the levers. For example, while days' inventory reduction has a higher potential for apparel retailers, it is of not much significance to drug retailers who will find supplier performance and credit terms monitoring to be far more beneficial Hence, the WCM playbook essentially looks at a structured approach to improve working capital performance based on the following aspects (Exhibit 9):
- Correlation between improvement in a metric and CCC (association levels)
- Potential impact in terms of additional free cash flow generated via improvement in the metric (financial impact contribution)
- Percentage contribution of potential improvement of the metric to total CCC improvement (days improvement potential)
Based on the aggregate results of our analysis in Exhibit 9, inventory, as a lever to improve working capital, has the highest impact in six out of nine sectors. For drug and food retail, payables will enable the most significant improvement in working capital performance.
In the next section, we take a look at tactical approaches for companies to improve their working capital performance.
Opportunities To Optimize Cash
It is important to understand that the WCM Playbook (Exhibit 9) is a guide to identify the key drivers of improved working capital performance for specific sectors at an aggregate level, along with a set of strategies, approaches and actions to affect the same. The specifics for each company will be
different, and the sector/ geography-specific considerations will have to be kept in mind to identify the most appropriate plan and execution strategy to improve working capital performance. WNS DecisionPoint™ has identified three broad themes for retailers to realize sustained advantage in their working
capital performance - real-time visibility and analytics, remodeling of payments and inventory policy, and supplier segmentation. In alignment with earlier findings, we have focused mainly on inventory and payables levers due to the limited role of receivables in freeing up working capital in this industry.
Real-time Visibility and Analytics
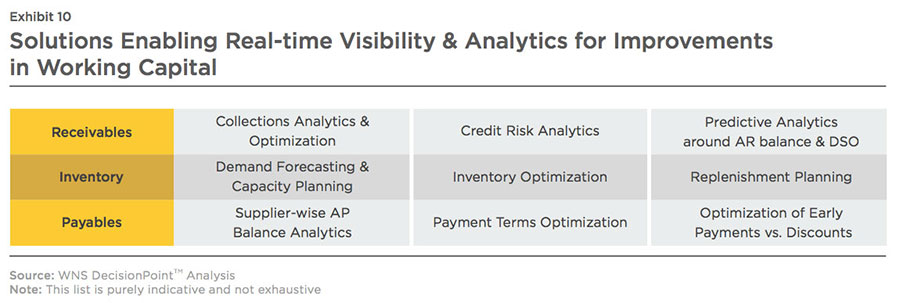
Identifying the bottlenecks in their working capital performance is the first step for retailers. A gamut of solutions (Exhibit 10) allows retailers to monitor performance and identify key pain points/ bottlenecks in the working capital cycle. For example, inventory optimization will enable a retailer to know the ideal level of inventory for a given particular SKU for the combination of a product and location.
Analytics solutions have evolved in terms of their complexity or sophistication, and the resultant business impact that they can create. While most retailers earlier focused on basic reporting, descriptive solutions, for example, customer segmentation and profitability modeling are emerging as a new baseline as retailers have reporting tools embedded into their MIS systems.
However, a majority of solutions that have a higher degree of business impact are either predictive or prescriptive in nature. They either define an optimum range for a particular metric such as accounts payable/inventory optimization, or they provide forecasts on future trends such as demand forecasting and capacity planning. To derive the best value from these solutions, retailers should pay heed to certain precautions. Typically for payables organization, DPO is considered to be the most relevant metric for working capital management. However, it is more of a directional and indicative metric rather than a robust metric to track the movement in cash. For example, depending on the composition of outstanding accounts payable balance, accrual adjustments in accounting entries will increase the outstanding balance, which, in turn, leads to an increase in DPO. However, materially there is no improvement in the cash flow and/or Earnings before Interest and Tax (EBIT). Additionally, insights from various analytical solutions should be coupled with ground level realities of the business ecosystem for retailers. For instance, managed sourcing spend is a strong basis to understand and segment the addressable and non-addressable spend and thereby prioritize opportunities. However, this exercise should consider the financial impact as well as operational feasibility.
Remodeling of Payments and Inventory Policy
Policy and strategy are dynamic aspects of any business. Whether it is payment terms or the evolving trends in SKUs, companies should monitor them and ensure best-in- class working capital performance.
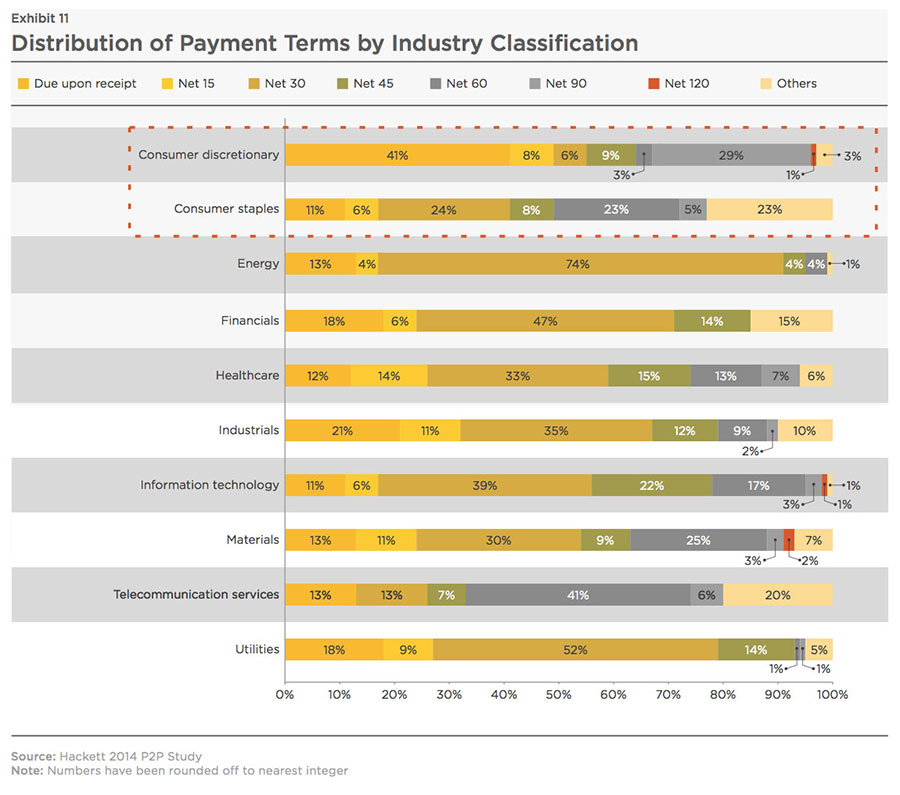
Extension of Net Payment Terms: There are no standard payment terms among retailers. This is a function of industry-specific factors such as format of the retailer, industry consolidation and supplier
relationships amongst others. However, we can broadly see the major prevalent payment terms between following types of retailers (Exhibit 11):
- Consumer staples:
Retail formats where the purchase takes place irrespective of the broader economy. Food retail, drug retail, hypermarkets and general merchandise store formats primarily belong to consumer staples
- Consumer discretionary:
Retail formats where the purchase is tied to the broader economic health. Apparel, department stores, e-commerce, electronics, home improvement and specialty stores belong to this category
The extension of payment terms with suppliers allows retailers to achieve longer payables' cycles, which can enable companies to hold on to their cash longer. Additionally, the extension of net terms also opens up opportunities to avail early payment based discounts. Companies can opt for a prorated discount if the payment is to be made after the discount term but before the net term. To explain this, let us take an example of a retailer who has a payment term of '4/30 Net 60'. This implies that while the payment is to be made before the 60th day of receipt of invoice, a discount of 4 percent is applicable if the payment is made before the 30th day. In this case, the retailer can pay suppliers on the 45th day instead and get a 2 percent discount. Another strategy of procurement functions is to offer payment terms to suppliers which provide for a discount of the invoice price if the invoice is paid early. In a dynamic global scenario, where the working capital requirement for a vendor organization is difficult to predict, suppliers are interested in flexible payment options. Even though their receivables cycle is getting stretched in the process, suppliers use the discounted early payments to address their short- term cash needs.
However, retailers should analyze the proportion of spend with contracted suppliers and calculate the pie of spend available for increase in payment terms. Contrary to the popular belief, scooping out all contracts for renegotiation for increase in payment terms is ineffective. The list of non-impactable contracted spend should ideally comprise mainly of contracts that are mandated by global/HQ teams, contracts that have just been closed within the last 6 months and contracts that hold strategic importance for the business. Companies should also move beyond negotiating purchasing terms strictly on the basis of price. When buyers do not factor in delivery costs, vendor discounts, and allowances, it affects the adjusted gross margin as these costs have a meaningful impact. Hence, apt due diligence needs to be done before the payment terms are changed since it might result in higher costs and the trade-off will become unfavorable.
In a dynamic global scenario, where the working capital requirement for a vendor organization is difficult to predict, suppliers are interested in flexible payment options.
Assortment Rationalization: Every SKU, which is part of the assortment, occupies space in the retailers' shelves, thereby generating additional variable costs in the process. Retailers in the past decade have added a multitude of SKUs, increasing complexity and cost of their supply chains. Unfortunately, the benefits of the same haven't been realized as an overwhelming array of choices can actually confuse consumers and decrease salesxv. Hence, retailers need to optimize their assortments to achieve higher inventory efficiencyxvi. Based on our analysis, retailers need to:
- Identify functions of various product categories. Certain products tend to be crucial as they have high sales volumes and high margins. On the other hand, specific SKUs have a strategic role in the store. While they may not necessarily command high margins or volumes, they play a major role in drawing crowds and positioning a retailer for cross- selling opportunities. SKUs not fulfilling either one of the above- mentioned criteria should be the first to get de-listed.
- Align the process to the appropriate target groups. Retailers must be able to meet shopper expectations and keep their overall messaging consistent. Rationalization happens best when operational and customer preference metrics are used in conjunction for priority customers who demonstrate a high degree of brand loyalty and are drivers of profitable growth. This was exhibited by Dollar General in 2014 as they removed health and wellness products that were expensive. Decision makers at Dollar General rightly identified the bulk of their customers as value conscious shoppers who avoided purchasing health and wellness products at deep- discount stores
- Apply assortment rationalization on a test market first. Based on the accuracy of planning and execution phases, assortment rationalization can have dramatic effects on a retailer's business. Smart retailers such as Target deployed their revamped assortments in specific test markets such as Chicago for food categoriesxvii. On observing a 100 to 200 basis point lift in same store sales, Target is rolling out their revamped assortments in more stores in a phased manner
Supplier Segmentation to Allocate Payments
A variety of payment strategies exist that retailers can consider to settle outstanding payables with suppliers. A level of prudence has to be demonstrated when renegotiating payment modes with suppliers. Our analysis shows that this is a function of availability of supplier alternatives for the retailer (supplier oligopoly) and value of spend (Exhibit 12). An immediate quick fix is to either increase payment terms as discussed earlier for suppliers in Quadrant 1 and 4, or extend accounts payable period using a purchase card (p-card) to pay suppliers.
A check provides only a day or two of float between the time someone deposits it and when the amount is paid from a retailer's account.
However, p-cards ensure that the vendor gets paid and the retailer doesn't have to pay for several more weeks as the value of the transaction is underwritten by a
bankxviii. Retailers would benefit more by due diligence on the type of card used and the specific transaction to be paid for, given the variations in card types (Exhibit 13). Based on this, retailers need to identify transactions backed by an invoice and use a virtual card4. to realize improvements in working capital performance. However, it should be noted that reducing the number of invoices and streamlining purchases for one-off transactions are the more important objectives of a p-card program. The impact in terms of improvement in working capital performance by increasing the DPO is limited.
For suppliers in Quadrant 2 who are considered to be of high strategic priority to the retailer, supply chain financing by a third party is a feasible option. Here, a third party purchases the suppliers' receivables in lien of a fee from the retailer. Hence, suppliers receive the funds prior to the net term and the third party settles advance payments with the retailer. For the retailer, it leads to the lengthening of payables cycle, at the same time mitigating risk which improves relationships with suppliers.
At WNS DecisionPoint™ we mapped the impact of various payment strategies on two key metrics, i.e. DPO and operating margin to understand financial and operational implications. As seen in Exhibit 14, impact of payment strategy varies by metric. For example, while the extension of the net term improves the DPO directly, the impact on the operating margin is muted due to the net payables remaining the same. On the contrary, early pay discounts will affect the DPO negatively as the time period of the payment shrinks. The additional cash flow accumulated as a result of discounts definitely improves the operating income due to lesser value of payables. It also reduces the COGS as a result of the discount received. In this context, companies can use a hybrid strategy where they extend payment terms and ask the suppliers for prorated discounts.
Quantification Of Business Benefits
Based on our analysis, we see that specific solutions / process improvement initiatives will enable better performance in working
capital management. And while achieving quick, initial gains is relatively easy, the key is to make the initiatives stick so as to ensure
sustainable improvement. However, for this to happen, retailers need to be aware of the correct levers as well as their potential impact.
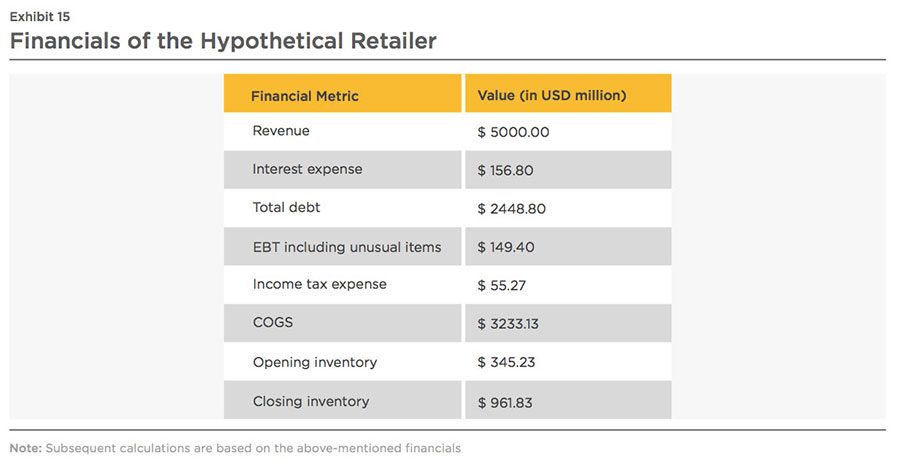
To illustrate this, let us take the hypothetical case of a general merchandise retailer deploying enterprise-wide real-time demand forecasting and capacity planning initiatives (Refer to Exhibit 15 for the financials). Let us assume that the company is an omni-channel retailer with resources allocated across offline and online channels. Hence, the contact centers have been equipped to aggregate the transactional data from various customer touch points and provide buying (procurement) and merchandising teams with a cohesive, real-time view of demand as well as inventory levels. This ensures that the service levels and customer satisfaction across channels is not affected as stock-outs are avoided due to the automated replenishment from warehouses. As a result of improved accuracy of demand forecasts, we have assumed a 10 percent reduction in inventory- carrying costs, translating to an additional USD 96.2 million in savings. Thus, inventory turnover improves from 4.9x for a particular fiscal year to 5.3x, as days' inventory reduces by ~11 days. Our analysis shows that this results in USD 102.3 million in additional cash flow for the current fiscal year, assuming the cost of debt capital to be 6 percent. This additional cash flow can be utilized by the retailer to either fund strategic initiatives around specific portfolios or enter new geographic / product markets.
Efficient cash utilization leads to effective working capital management and ensures companies have little /no requirement for external financing instruments such as debt which often comes at a premium and weakens the cash position of companies'. It is to be noted that the estimates pertaining to additional cash savings are only for a year, and replicating a tight fiscal management discipline over a period of time will allow the retailer to obtain a much stronger position in the industry compared to its competitors.
Appendix5.
References:
i. Based on Analysis of Retail Sales Data (exc. Automotive Parts & Dealers), US Census Retail Trade Survey and UK Office of National Statistics, Extracted October, 5, 2016.
ii. BWhy the Luxury Sector has to Adjust to a 'New Normal'?, April, 2016, Cnbc
iii. Unsold US Retail Inventory a Challenge after Dismal Earnings Season, May, 2016, Reuters
iv. Consumer Demand Signals Reveal Chinks in Amazon's Armor, October, 2015, Retail Touchpoints
v. Lands' end Partners up with Amazon to Move Some Clothes, September, 2016, Consumerist
vi. Home Depot Profits from Sound Supply Chain Management, March, 2015, Market Realist
vii. Retailers Rethink Inventory Strategies, June, 2016, Wall Street Journal
viii. Home Depot Turns Inventory Faster with New Supply Chain Software, January, 2016, B2B Ecommerce World
ix. 8 Perspectives on Wal-mart's New Supplier Costs, July, 2015, Retail Dive
x. Target Stores Rethinks Inventory Management, Writes Own Apps to Better Leverage Extended Supply Chain in Omnichannel World, Supply Chain Digest, March, 2016
xi. Walmart Testing Drones for Dc Inventory Management, Multichannel Merchant, June, 2016
xii. How Real-time Data is Putting Success at our Fingertips, Walmart Today Newsletter, June, 2016
xiii. Sales Growth Moves Tesco Back into Profit, Logistics Manager, April, 2016, Logistics Manager News
xiv. Corporate Working Capital Management: Determinants and Consequences. Kieschnick, R., Laplante, M. and Moussawi, R., 2006, International Journal of Managerial Finance, 3(2), PP.164-177
xv. Scheibehenne, B., Greifeneder, R. and Todd, p.m., 2010. Can there ever be too many options? A Meta-analytic Review of Choice Overload. Journal of Consumer Research, 37(3), PP.409-425.
xvi. Tesco Cuts Product Range to Accommodate more Fresh Food, International Super Market News, February, 2016,
xvii. Q3 2015 Earnings Call Transcript, Target, November, 2015, Extracted on September, 2016
xviii. Based on Data from 2015 Hackett P-card Optimization Webcast, Extracted on December, 2016