Introduction
The healthcare sector ("the sector") is an essential cog in the wheel of human life, impacting both its quality and longevity. For obvious reasons, health is a prime and political concern in all regions. Major developed economies like U.S., Japan and UK spent ~8-17 percent of their GDP on healthcare in 2014 (See Exhibit 1).
Developments expected to lower the pharma industry size and profitability include patent expirations that could potentially erode $65 billion of industry's revenue by 2019; generics promotion by Japan (increase the generic usage from 39 percent in 2010 to 60 percent or higher of market by March 2018ii); cost containment strategies adopted by providers, largely in the U.S.; consolidation of providers in the U.S.; and declining prescriber access to sales representatives in key specialty areas in the U.S. and EU, and others
The expenditure, as a percentage of GDP, is estimated to rise further in emerging economies (China, Indonesia, and Malaysia to name a few) and the U.S. for the next few years. However, tighter budgets in developed economies, particularly in the UK and Japan, may cause healthcare spending (as a percent of GDP) to decline there.
Recently, the sector underwent a lot of significant changes, with the pharmaceutical industry ("the industry") largely under the spotlight. Trends likely to boost the industry revenue include rising chronic diseases; sedentary lifestyle; ageing in developed economies; increasing healthcare spending in emerging economies and U.S.; and expanding health insurance coverage globally.
Developments expected to lower the industry size and profitability include patent expirations that could potentially erode $65 billion of the industry's revenue by 2019i; generics promotion by Japan (plans to increase the generic usage from 39 percent in 2010 to 60 percent or higher of market by March 2018ii); cost containment strategies adopted by providers, largely in the U.S.; consolidation of providers in the U.S.; and declining prescriber access to sales representatives in key specialty areas in the U.S. and EU (among other countries). Despite the above transformation, the industry is expected to clock a Compounded Annual Growth Rate (CAGR) of 3-6 percent in revenue over 2013-17iii. Maintaining margins is increasingly becoming difficult because of the aforementioned reasons. IMS Health (one of the leading healthcare information, services and technology companies) has predicted that top 17 pharmaceutical companies need to cut $36 billion in Selling, General and Administrative (SG&A) costs by 2017 to maintain an operating margin similar to 2012.
To understand the impact of some of the above factors (see Exhibit 2) on pharma companies, DecisionPoint™ developed its proprietary Buyers Power Index (BPI Exhibit 3). The index is a function of pre-defined parameters or input variables such as generic sales contribution, consolidation of hospitals, physician access and out of pocket expenditure as a percent GDP. BPI measures the change in negotiating power of payors and providers (buyers) on pharma companies. The aim is to understand the relationship between the negotiating power of buyers and pharma organizations
Top 17 pharmaceutical companies need to cut $36 billion in SG&A costs by 2017 to maintain operating margin similar to 2012.
Key reasons for the margin squeeze include:
- Rising generic sales contribution (to total pharma industry)
- Consolidation in hospital landscape
- Declining physician access
- Shrinking out-of-pocket expenditure
It was discovered that influence of the buyers (payors and providers) has increased significantly from 2009 to 2014. BPI rose as much as by 20 percentage points.
If the BPI rises further by 20 percentage points by 2017, Gross Margin of the Industry is likely to fall by 3.6 percent.
Alarmingly, BPI is expected to rise further going forward as generic contribution increases from 19.3 percent in 2014 to 22.7 percent in 2020, more hospital consolidation takes place, physician access becomes more restricted and out of pocket expenditure reduces from 11.1 percent in 2014 to 10.2 percent
in 2020.
WNS DecisionPoint™ studied the correlation between BPI and Gross Margin of the top 10 U.S. pharma companies (as a sample), discovering that there is a
-56.8 percent inter-relationship between the two. It was identified that, if the BPI rises by 20 percentage points more by 2017, Gross Margin of the Industry is likely to fall by 3.6 percent.
Alarmingly, BPI is expected to rise further going forward as generic contribution increases from
19.3 percent in 2014 to 22.7 percent in 2020^, more hospital consolidation takes place, physician access becomes more restricted and out of pocket expenditure reduces from 11.1 percent in 2014 to 10.2 percent in 2020^. Therefore, Gross Margin is likely to fall further in future.
73 percent respondents mentioned that selling and marketing pharmaceutical products has become more difficult in the U.S. during the last four to five years. Stringent regulations like Physician Payment Sunshine Act (PPSA) require drug and device companies to record and report, for eventual publication, their payments to health-care providers and medical practitioners. Also, PPSA allows firms to analyze marketing spending of their competitors' data.
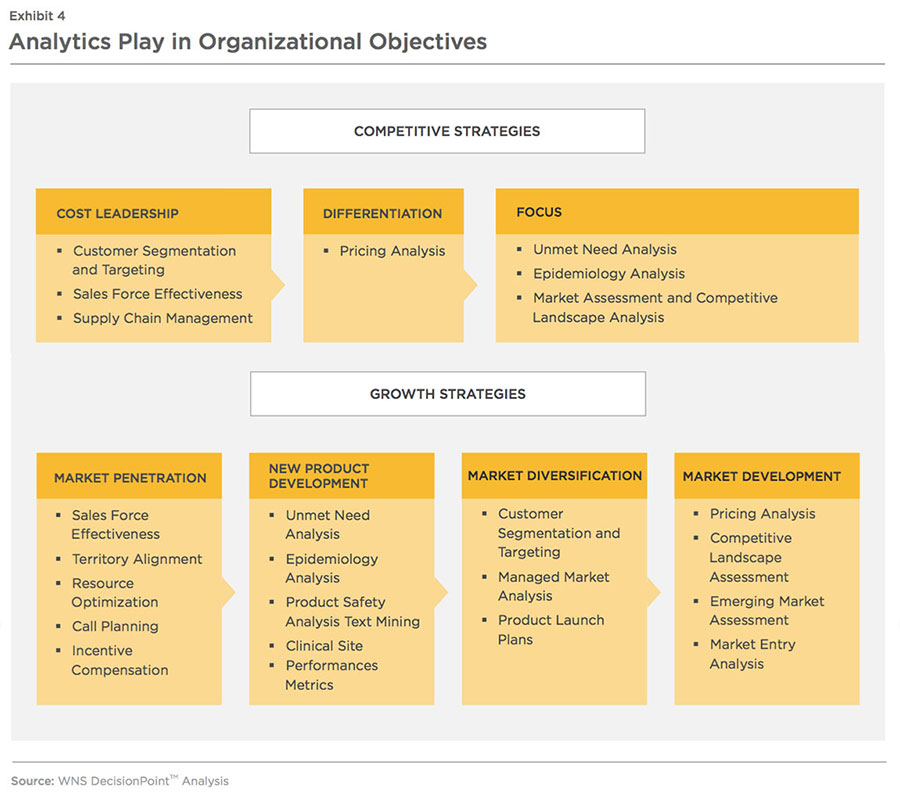
To limit the adverse impact from rising BPI, pharma companies need to successfully persuade prescribers and providers to buy more of their products. In addition, selling and marketing expenses also need to be optimized to achieve efficient and effective commercial operations. Exhibit 4 explores how analytics can aid pharmaceutical companies in meeting these objectives.
To limit the adverse impact from rising BPI, pharma companies need to successfully persuade prescribers and providers to buy more of their products. In addition, selling and marketing expenses also need to be optimized to achieve efficient and effective commercial operations. Exhibit 4 explores how analytics can aid pharmaceutical companies in meeting these objectives.
67 percent of survey respondents mentioned that their company is currently seeking the services of specialist analytics companies for meeting specific requirements. However, insights from analytics are underutilized, and actions taken from insights are limited.
77 percent of organizations still seek greater insights and value from available data (including but not limited to claims, clinical trials and patient data) as per IMS Health Survey in 2014iv. To accomplish
higher usage, some large organizations are using embedded process intelligence (ePI), a mechanism to infuse analytics within the organization to make decisions using scientific approaches rather than being intuitive. Use of ePI in pharma companies is likely to reduce the workload of the sales force and improve the target setting process by taking into account comprehensive set of factors affecting the market. Moreover,
ePI leads to improved customer response to campaigns and, hence, increased revenue and helps measure return on marketing investments. It also helps in making proactive decisions around the design of clinical trials, including the selection of the patient population and comparator drugs in drug development process and the drafting of managed care related strategies.
Strategies To Retain Competitive Advantage
Maintaining a competitive advantage in this fast changing industry landscape is becoming difficult for pharma companies. Enterprises are pushing themselves hard to drive commercial excellence. Some strategies being employed are
- Embracing smaller size drug launches to diversify and reduce sales attrition risks
- Planning and adjusting launch plans according to uptake experience
- Driving fast-paced but high-quality research and development
- Understanding patient needs, competitor tactics and payors/providers' expectations in order to reduce drug failures in pre and post launch phases
- Controlling SG&A expenses
- Creating more robust account management and selling strategies to combat declining physician access
- Increase geographical expansion
Achieving operational efficiency
is especially crucial given the likelihood that the aforementioned developments will reduce industry size and profitability. To be successful with the above strategies, analytics will continue to be a critical and essential enabler.
Risk Diversification Leading To Smaller Size Drug Launches
Product launches is the single most important factor defining a pharma company's success in terms of
Exhibit 5
equalizing sales erosion from patent expiries, meeting earnings targets and generating shareholder
value. Exhibit 5 enumerates the key drugs' patent expiries between 2015 and 2019.
Blockbuster drugs (yearly sales
> $1 billion), with patent expiry during 2015-19 either in the U.S. and Europe, include Abilify (Otsuka and BMS), Herceptin (Roche), Lantus (Sanofi), Erbitux (BMS and Merck), Tsyabri (Biogen), and Synagis (AstraZeneca).
Sales erosion from patent expiries is likely to cost the industry more than $65 billion in revenue by 2019 (from 2014 levels). This is because generic manufacturers sell off-patent drugs at a price significantly lower (potentially as low as 90 percent) than the price in
the pre-expiry period, depending on the therapeutic area and the type of drug (biologicals, statins, chemicals etc.). This helps generic players capture majority of the volume (80-90 percent) sold by branded drug manufacturers within a few years after expiry. In some cases, this could take as little as six months. The selling price of the drug diminishes further as time passes. Exhibit 6 shows examples to highlight the impact of patent expiry (particularly in the U.S.)
on sales.
Sales erosion from patent expiries is likely to cost the industry more than $65 billion in revenue by 2019.
Mounting pressure on major economies to reduce their fiscal deficit is pushing pharma companies to promote the usage of generics in order to cut public healthcare spending.
Apart from the above, mounting pressure on major economies to reduce their fiscal deficit (see Exhibit 7) is pushing them to promote the use of generics in order to cut public healthcare spending.
For instance, the Japanese
government declared a plan to promote usage of generic drugs in Apr'13. This is expected to increase the volume share of generic drugs to 60 percent or higher by March 2018 (vs. 39 percent in 2010). To reduce the impact of sales erosion
of blockbuster drugs on account of patent expiry, many companies with branded drugs have launched smaller size drugs and are focusing on specialty areas (like oncology). The top 10 pharmaceutical companies based on market capitalization (as of March 3, 2016)
have seen their blockbuster drugs (those with an annual revenue > $1 billion) contribution to total pharma revenue decline from 55.6 percent in 2010 to 53.9 percent in 2015^.
U.S. Food and Drug Administration approved 45 new drugs in 2015 as compared to 41 in 2014 and 27 in 2013v. However, higher approval rates do not lead to improved revenue prospects for the industry since most of these drugs launched are me-too products with low commercial prospects because of the reduced pricing power.
As per a McKinsey studyvi, revenue from the top 10 products of pharmaceutical companies in 2014 is half of that in 2008. The study, as of 2013 also identified that 61 percent of the late stage drugs had little or no differentiation. Moreover, Boston Consulting Group, which tracks a larger set of drug approval agencies, including Center for Biologics Evaluation & Research (CBER) and supplemental new drug application (sNDA) apart from CDER^, predicts that the commercial prowess of 53 drugs approved in 2014 will generate aggregate peak sales of $48 billion as compared to $53 billion for 36 drugs approved in 2013, pointing towards industry focusing on more launches with low commercials.
With launches becoming numerous, smaller, and more competitive, sales, marketing and distribution efforts would also increase as companies struggle to meet pre-launch sales expectations from their initial few years in the market. This means that more physicians or providers will need to be contacted about various drugs, by sales representatives through various distribution channels.
WNS DecisionPoint™ is of the view that these launches, be they for strongly differentiated drugs or for undifferentiated products in
well-established disease areas or unestablished disease areas, need to be carefully planned. Each of these drugs will have a different set of critical success factors. Pharma companies should start with an initial level of analysis that includes studying claims, clinical and patient data (including social media data) to generate useful insights around launch action plans with the goal of creating a distinguished positioning and ensuring maximum usage post launch. This analysis should also consider risks and mitigation measures, as well as monitoring and control mechanisms to enable the adjustment of commercial strategies against competitor tactics, regulatory changes, distribution landscapes and payor and provider dynamics post launch, especially during the first 12 months when the product sets the trajectory for its lifecycle. The companies should also adjust commercial strategies based on the drug's early experience uptake in the market.
Post patent expiry, analytics can aid in redesigning customer strategies, refining segmentation, and optimizing marketing mix. Even multi-channel strategies can be redirected and e-channels can be sensibly leveraged to achieve cost-efficient promotion. But the first step towards getting all these things right is an accurate forecast of drug's revenue (volume as well as price impact) post loss of exclusivity.
In a second level of analysis, companies can, based on usage patterns, identify physician behavior and classify them as innovators, early adopters, early majority, late majority and laggards based on the speed of adoption of new treatments and drugs they prescribe. Physicians can be further prioritized by the number of patients they are catering to (to derive the potential dollar value). Insights should also aid segment payors on an affordability basis (budget, level of generic prescription, medical loss ratio etc.) to enable the determination of value propositions (pricing, reimbursement, collaborations) accordingly.
A third level of analysis should focus on the regional attributes of where the drug is being launched. It should cover details regarding patient demographics including medical history and their behavior (switching history), regulations and competition. Monitoring the landscape of payors, providers, patients, prescribers, competition and regulations and taking remedial measures is equally important as using insights post launch.
As proof of an effective strategy to counter patent expiry, take a look at Pfizer and the drug, Lipitor. Here are some of the commercial strategies adopted by Pfizer to maintain revenue and market share before and after the patent expiry of Lipitor in the U.S.:
- Entering into a pay-to-delay model with Ranbaxy to defer the launch of a generic, atorvastatin, from Jun'11 to Dec'11 in the U.S.
- Launching an authorized generic in conjunction with Watson Pharmaceuticals, which helped Pfizer diminish other generic sales
- Giving coupons to the consumers to greatly reduce their co-pays to encourage them to stay on the branded Lipitor and not switch to the generic equivalent
- Paying rebates to insurers and/or pharmacy benefit managers to keep using Lipitor
Lipitor lost exclusivity in Japan in June 2011 (with generics entering the market in November 2011), in Australia in April 2012 and in most of developed Europe in March 2012 and May 2012. Lipitor controlled about 33 percent of the U.S. market (in terms of volume) nearly four months after generic entry (early March 2012), and maintained three times more market share than what is traditionally seen when blockbusters lose patent protectionvii. The table below (Exhibit 8) traces the sales of Lipitor, one of the best selling drugs in the industry, during the last few years before and after the patent expiry in the U.S. and global markets.
To complement the above strategies and minimize the impact of Lipitor's patent loss, Pfizer used analytics effectively for employing a scalable and cost-effective operating model. It is important
to note that Pfizer did not enjoy the same operating buffer (in terms of capital allocation) after
Lipitor's expiry.
Analytics helped Pfizer utilize capital resources rationally after the patent loss of Lipitor. With the use of analytics, customer strategies were redesigned, segmentation was refined, and the marketing mix was optimized. Even multi-channel strategies were redirected and e-channels were sensibly leveraged via analytics to achieve cost-efficient promotion.
The first condition for getting all these factors right is having an accurate forecast of a drug's revenue (volume as well as price impact), post loss of exclusivity. Being one of the pioneers in analytics and having a highly mature analytics center helped Pfizer outperform its peers, as seen below (Exhibit 9 & 10).
Using analytics, Pfizer was able to understand requirements of payors and providers and accordingly initiate suitable actions around pricing and reimbursement, compliance to regulatory mandates, and rebates and discounts.
Sales presentations to physicians /buyers were adapted based on how physicians approach the care of their patients and how they absorb information.
For example, a certain segment of doctors in a region may have a greater proportion of elderly patients, and they will often want to hear about drug-drug interactions first (since their patients are on multiple medications). Pharmaceutical companies can also ensure that sales representatives are using approved and up-to-date materials and interacting only with relevant healthcare providers.
Analytics can also be used for real-time tracking of the delivery of recommended content to the target segment by sales representatives. For instance, most Pfizer sales representatives use tablet PCs to give presentations. Recording interactions with the tablets and storing the click-stream data provides a record of running order, messages delivered and whether the physician found the content engaging.
Regulation Stipulating Higher Innovation And Efficiency
The Affordable Care Act (ACA) was passed in March 2010 to contain healthcare costs, expand insurance coverage and strengthen the care that Medicare (U.S. national social insurance program) beneficiaries receive. ACA accelerates the transition of U.S. healthcare into a capitated and value-based, consumer- empowered model (vs. fee-for- service model), which will discourage wasteful consumption of medicines. This will lead to providers sharing both the upside as well as downside of medicine consumption with payors. The Act is likely to boost prescription sales in the U.S.
ACA also calls for implementation of various cost saving measures to reduce Medicare spending. Without reform, Medicare spending (annually) was projected to grow at 6.8 percent from 2009, reaching roughly $978 billion by 2019. As a result of reform measures, Medicare spending growth is likely to reduce to 5.3 percent, reaching $852 billion by 2019 - a ten-year cumulative savings of over $575 billion (as per Centers for Medicare and Medicaid Services (CMS) estimates). Reduced Medicare spending is expected to exert pricing pressure on pharmaceutical companies and lower their margins. Some of the key cost containment strategies, as part of ACA, are outlined in Exhibit 11.
The Affordable Care Act calls for implementation of various cost saving measures to reduce Medicare spending. Without reform, Medicare spending (annually) was projected to grow at 6.8 percent from 2009, reaching roughly $978 billion by 2019. As a result of reform measures, Medicare spending's growth is likely to reduce to 5.3 percent, reaching $852 billion by 2019.
Out of pocket expenditure has reduced from 12 percent in 2009 to 11.1 percent (estimated by CMS) in 2014 in the U.S., imparting more say to the payors in the pharma drug purchases by hospitals.
Hospital consolidation intensified following the ACA enactment in the U.S. to manage its cost saving provisions. During 2011-13, more than 270 mergers and acquisitions (M&A) deals were announced (spread uniformly across the years). In 2014 only, there were 95 M&As and which was higher than the average transaction count of 50-60 per year prior to the
legislationviii. The consolidation trend gives the combined entities more buying power against pharmaceutical manufacturers, and in turn lowers the industry's margins. Cuts to medical reimbursement every year are expected to keep the healthcare providers on their heels in the U.S. and may force them to ask pharma companies to reduce prices.
Naturally, innovation (in terms of new products) and cost efficiency initiatives are two alternatives to mitigate the pricing pressures. Innovation picked up in 2015 as 45 drugs were approved by FDA vs 41
in 2014, and 27 in 2013ix. One of the reasons for the improved productivity could be the increasing focus of pharmaceutical companies on fewer therapeutic areas, as reflected in the recent asset swapping deals. Other reason for the increased approvals is that most of these new drugs were hurriedly approved along (by pharma companies) to fill gaps created by patent expiries of blockbuster drugs. As mentioned earlier, most of the drugs (sample size was 60) in late-stage pipeline in 2013 were undifferentiated drugs. Launching another me-too drug in an already crowded market where cheap generics are already available makes achievement of commercial targets all the more difficult for the sales force. Further, with stringent regulatory approval process and rising costs of healthcare, present stakeholders (regulators, payors and providers) are having greater say in the drug development process. Regulators are checking whether safety and efficacy parameters are above those provided by current treatment regimens. Payors are also demanding more value for their money from drugs to contain rising healthcare costs. Pharmaceutical companies with poorly differentiated products are finding it tougher to get reimbursement from payors. Providers are also not willing to use drugs/treatments which don't provide incremental safety or efficacy benefits.
Non-robust economics, unclear clinical benefits, improperly designed clinical trials, inappropriate comparator drug/treatment, unsuitable patient population, safety concerns and lack of competitive differentiation are some of the major reasons for drug failures in pre (clinical trials) and post launch era. This justifies the need for strategic insights
around patients' needs, competitors' strategies, and stakeholder expectations early in the drug development process to aid delivering an acceptable return on investment (ROI).
These insights should be able to answer the following key questions:
- What are the compliance, efficacy and safety gaps in existing treatment regimens for specific compound indications?
- What are the potential population subsets with unmet needs?
- Which indications (if planning for multiple indications) will offer higher potential returns?
- What is the market potential of the drug based on preliminary data generated from phase 2a and phase 2b clinical trials?
- Is the drug sufficiently differentiated (based on data analysis, predictive modeling & simulation, from early stage (phase 2) trials) in terms of safety and efficacy attributes?
- Has the company selected the right set of patients in clinical trials with optimal risk-benefit profile for the compound?
- What is likely to be the future standard of care based on the study of competitors' pipelines/landscape?
- What are the registration requirements of regulators by geography?
- What kind of data/outcomes do the regulators require?
- What is needed to obtain payor/health technology assessment bodies' approval when a new product is ready for market?
On the other hand, companies lacking innovation capabilities and capital to invest in R&D could resort to cost cutting measures. The measures are likely to differ for each company. However, pharmaceutical companies are likely to reduce sales, marketing and administration costs, which account for almost 30 percent of Net Sales. Most of the companies expect to shave off 6-10 percent from the commercial operations related costs by March 2017 (for more details, see Exhibit 12).
Following the ACA enactment, hospital consolidation intensified in the U.S. to manage its cost saving provisions. During 2011-13, more than 270 deals were announced (spread uniformly across the years). Prior to the legislation, the deal number ranged 50-60 per year during the last few years.
Pharmaceutical companies are likely to reduce sales, marketing and administration costs, which accounts for almost 30 percent of Net Sales, in response to pricing pressures culminating out of hospitals' consolidation and cost containment strategies.
Some of the key focus areas of pharma players to reduce costs in commercial operations are listed
in Exhibit 13.
Most pharmaceutical organizations are striving to build stronger customer relationships; do more with less; and improve the speed and effectiveness of decision making, in a bid to stem the margin decline and tap additional revenue opportunities. Key pharmaceutical industry needs (as of Mar'14) are detailed in Exhibit 14.
Payors & Providers' Upper Hand In Purchasing Decisions Demands Robust Account Management And Selling Strategies
Influence of payors and providers in purchasing decisions is rising whereas physicians' access is waning, as indicated by reduced access to pharmaceutical sales representatives. In the U.S., access to ~49 percent of the prescribers was restricted for sales representatives in 2014, up from 22 percent in 2009-1010x. Access to physicians is even stricter in Europe.
A greater number of physicians are using mobile and digital channels to receive news, which is another major reason for the decline in physician access (in addition to
nexus between payors and providers, where physician practices are being bought by hospitals and payors). Apart from centralized purchasing, payors and providers also establish more rules and limit physician interactions with sales representatives. This gives them an upper-hand while negotiating for reimbursement and prices.
In response to the above, many pharmaceutical companies have shifted to a key account management model, which relies on contracting to compete for market share.
In the U.S., access to physicians has declined steadily from 78 percent in 2009 to 51 percent in 2014. This decrease in physician access is mainly driven by "payor-provider nexus," where insurers and hospitals buy physician practices and mandate policies that restrict access. The access is even stricter in the Europe.
An account manager must be well versed with insights on managed care players to take suitable actions about pricing and reimbursement, regulatory compliance, rebates and discounts etc.
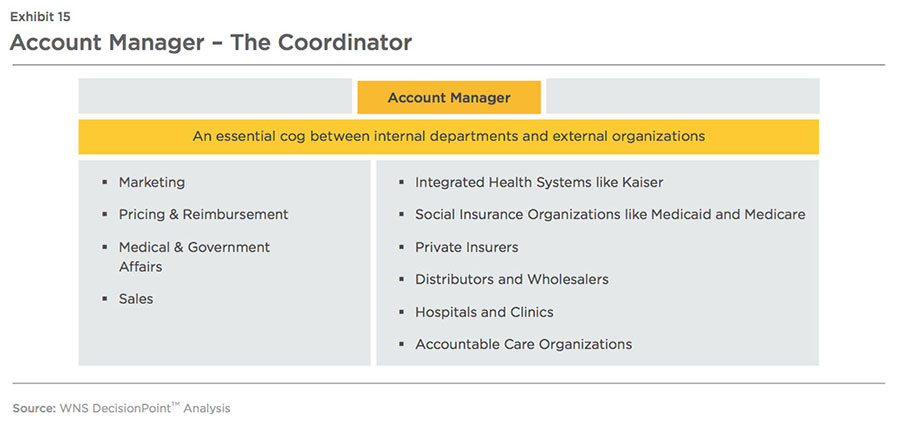
Successful key account management requires companies to have a deep understanding of payors/providers/prescribers/ distributors' operating models, needs, and objectives and enable cross-functional collaboration (between marketing, customer service, sales, public and medical affairs, and other departments).
A focus on joint value creation also enables effective account management. For instance, a U.S.- based pharmaceutical company and its health maintenance organization customer jointly developed a patient registry and outcomes-monitoring program with a large teaching hospital*.
Pharma companies spend lot of time, money and effort
adjudicating contracts with payors, providers and distributors. An account manager must be well versed, with insights on these managed care players, to take suitable actions on pricing, reimbursement and contracting strategies. Analytical tools can ingest data and turn it into insights for the account manager (see Exhibit 16).
The majority of the drugs sold in developed markets are reimbursed through managed care organizations including private health insurers and social insurance organizations. The role of these players is to ensure low costs and high quality of care by implementing
- Formulary tier placement (list of drugs by tiers for which payors/insurers will pay for)
- Prior authorization requirements (from doctor for coverage of a particular drug), quantity limits (usage of drug for a particular period)
- Step therapy (a type of prior authorization but by using a less expensive drug first for the treatment)
- Co-pay requirements (fixed payment by the patient or the user for the medical service)
Moreover, given the waning influence of prescribers, many pharmaceutical companies have curtailed the size of their sales force (refer Exhibit 17), particularly in the U.S.
Globally, there was a decline of
1.2 percent Year over year (YoY) in sales force levels to 424,000 full-time equivalents (FTEs) in 2013. North America witnessed a drop of 7.4 percent while top EU-5 countries (UK, Germany, France, Spain and Italy) suffered a reduction of 7 percent. However, in 2014, there was a slight increase of 0.4 percent YoY in sales force FTEs. Reduction in FTEs continued in both North America and Top 5 EU countries by ~2 percent and
5 percent respectively. China and Brazil again were the exceptions in 2014 with a YoY growth of 11.4 percent (9 percent in 2013) and 2.4 percent (4.4 percent in 2013) respectively. Contrary to stable sales force levels in 2013, Japan's staffing levels decreased by 4.8 percent YoY to 52,353 sales FTEs in 2014xi
Pharma companies are striving to do more with less by cutting marketing costs. There was a
1.4 percent YoY reduction in marketing costs in 2014, globally (see Exhibit 18). The use of digital channels for promotional purposes is gaining traction although share of digital spend in marketing was insignificant in 2014 as compared to other digitally active industries like retail, financial services, media.
A sales representative visit must not only be considered a revenue generation opportunity but also as an information gathering event in order to generate insights around physicians affinity to channels, their needs and preferences, their consideration criteria and so on.
However, by simply controlling sale and marketing expenses, pharma companies may lose potential revenue opportunities. Instead, pharma companies can adopt the sales and marketing strategies implemented by successful industry peers:
- Developing competencies of sales force staff according to the current market needs
- Growing buyers' (physician/payor/provider) satisfaction and loyalty to increase repeat sales
-
Developing tailored messages and creating more meaningful interactions by segmenting physicians and other stakeholders by behavior, attitude, indications, and other factors
- Understanding physicians/payors/providers' affinity for different channels
-
Optimizing use of social media and multichannel marketing to understand customer sentiments and create differentiated positioning
- Monitoring sales force metrics (number of attempts per lead, percentage of call connects, opportunity conversion rate, etc.) and making tactical decisions based on them
- Increasing sales technique, disease state product knowledge and compliance training
- Reducing time spent on administrative tasks such as travel and expense reporting
Adopting these new sales strategies is more crucial than ever. Governments around the world are discouraging gifts and payments to doctors in order to reduce unnecessary prescriptions. Sales representatives work on a commission basis and, therefore, they have a vested financial interest if physicians write more
prescriptions. Unnecessary prescriptions result in higher healthcare costs for governments.
Countries like the U.S. have already passed the PPSA, which require drug and device companies to record and report, for eventual publication, their payments to health-care providers. China is improving its healthcare regulatory system and has recently fined various companies for bribery. Other main markets are likely to follow suit given the increasing importance of access to healthcare and at the same time, cost control. The advent of these restrictions is likely to impact sales adversely. Having effective sales and marketing strategies in such a controlled working environment (in terms of maintaining profits and complying with regulations) should help pharma organizations establish stronger relationships with patients, healthcare providers and other stakeholders. Exhibit 19 highlights how analytics can be used to improve sales and marketing effectiveness.
Analytics tools are mainly being used for improving sales force effectiveness, territory management, and sales force design.
Leveraging Analytics To Boost Drug Consumption Further
Ageing is one of the primary drivers for consumption of medicines worldwide, with population having age 65+ as the
main consumers. This segment of the population is on the rise, particularly in developed countries (as depicted in Exhibit 20) and is
expected to maintain the upward trend in future, providing more revenue opportunities to pharmaceutical companies.
Another factor bolstering the drug uptake is increasing threat of deaths from chronic diseases and conditions, such as heart disease, stroke, cancer, diabetes, obesity, and arthritis. Most governments are shifting their focus to preventive care to slow down the growth in prevalence of diseases, creating further opportunity for the pharmaceutical industry to grow its business.
Growing emphasis on healthcare in developing economies is another top-line driver for the industry.
These economies contribute very little to overall pharma industry revenue; however, the sheer volume they offer (in terms of absolute prevalence of diseases) is significant despite the low affordability and lack of available infrastructure in these countries. Health expenditure as a percentage of GDP is estimated to rise in countries like China, Malaysia
and Indonesia.
In order to successfully tap into these opportunities and further amplify the associated benefits,
pharma organizations can develop relevant sales and marketing strategies as mentioned before. Analytics is likely to enable pharmaceutical organizations to discover the unmet needs of high value drugs based on patients' medical data and trends. It would also help pharma organizations to change their ways and means of designing marketing campaigns. Exhibit 21 showcases the use of analytics as a key driver for innovation and growth.
Embracing Analytics-Driven Decision Making
More and more sales representatives are using digital channels and technologies to interact with customers (providers and payors) and engage with them more effectively. As per a survey by Quantia (which has a registered network of 225,000 physicians in
the U.S.) in Dec'13, 67 percent of physicians prefer digital access to pharma product informationxii. Analytics tools use this data and generate insights/action triggers to solve challenges related to revenue growth, innovation, costs and profitability concerns in the
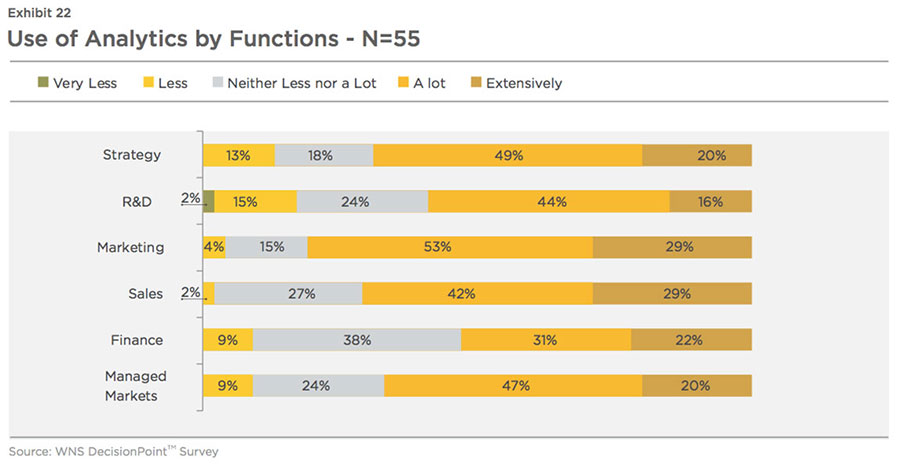
industry. At present, sales and marketing departments employ analytics more than any other department (based on the top two scales of 'A lot' and 'Extensively'), as shown in Exhibit 22.
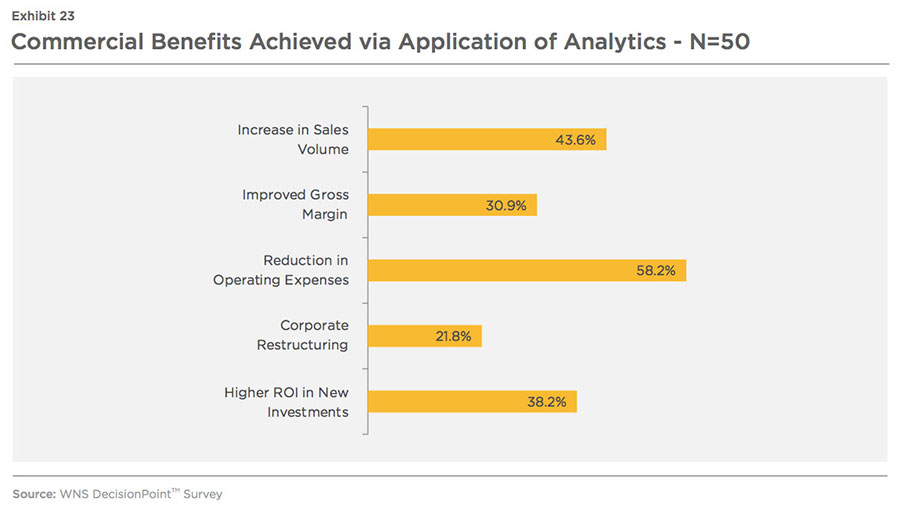
Most of the companies are satisfied (satisfied -60 percent, very satisfied -5percent, unsure-35 percent) with the ROI on analytics. 87 percent respondents (see Exhibit 23) said that they have achieved certain commercial benefits (such as an increase in revenue growth and profitability) from the application of analytics. For example, Novartis, beginning in 2001, used annual sales force effectiveness reviews to drive six consecutive years of revenue growth. Roche also grew its market share by three percentage points over a 1.5 years period after developing
an analytics driven sales culture (time period unknownxiii). A tougher regulatory environment has also contributed to increasing use of analytics in the pharma industry. For example, PPSA regulation allows firms to analyze data on the marketing spend of competitors. Companies have collated and standardized data from various sources ranging from physician notes, clinical trials, sales representative data, electronic health records, claims and so on. Data from digital channels and social media networks in the form
of emails, videos, audios, chat transcripts, photos etc. are also increasingly being used to understand patient/physician demographics and behavior. With all this available data (integrated via analytics tools and technologies), predictive and prescriptive modeling is fast gaining pace in the pharmaceutical industry. Firms are now able to forecast product revenue, analyze customer lifetime value and predict adverse events, track brand performance and accordingly, optimize capital allocation.
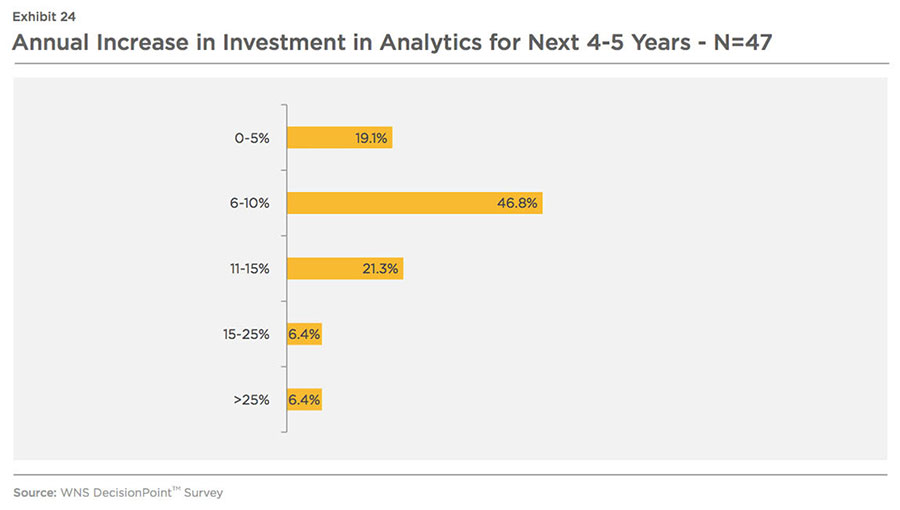
85 percent respondents are planning to increase their investments in analytics. Most of the respondents estimate a 6-10 percent annual increase in analytics spending in the next four to five years from 2015 (refer Exhibit 24).
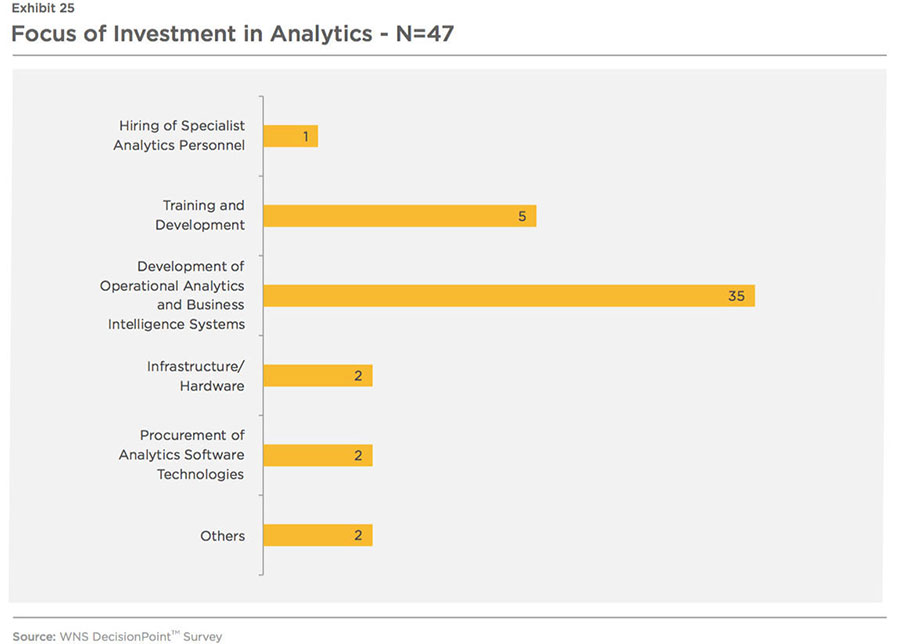
Unsurprisingly, the investments are expected to be focused on development of operational analytics and business intelligence systems (see Exhibit 25).
The majority of the budgeted expenses are being earmarked for marketing and sales and regulatory compliance departments. Semantic capabilities to harness unstructured data and integrate it with structured information to generate more useful real-time insights are
being developed. Firms are making investments in big data technologies like Hadoop to process both structured and unstructured data. There will likely be a growing use of automated tools to detect patterns in unstructured data. Meaning Based Computing (MBC) is one such tool, which recognizes all forms of unstructured data. Next-generation MBC technologies connect various information forms of data (audio,
video, emails, tweets, comments etc.), recognize relationships and concepts, and then send trigger action across all customer-facing channels. These types of automated tools use various techniques such text tagging, annotation, and ontology to provide standardized and processed information at speeds demanded by end users and business processes.
Looking ahead in the next 2-3 years, strategy, sales, and marketing departments again are likely to be the top three end user groups as highlighted in Exhibit 26.
Exhibit 27 shows top three applications of analytics in strategy, sales and marketing departments.
Despite a bright potential future, the use of insights from analytics currently remains underutilized in the industry and 77 percent of organizations (per IMS Health Survey) still seek greater decision-
making value from data. The reason for underutilization of analytics could be the low adoption of a centralized operating model (only 11 percent respondents in WNS DecisionPoint™ survey).
Some of the potential impediments towards the effective implementation of analytics in the pharmaceutical industry are listed in Exhibit 28.
Analytics is of little value if not used actively. Many large pharma organizations, therefore, are translating analytics into action triggers to be embedded in the work process. Embedding analytics into work processes makes it difficult for decision makers to avoid their use and therefore helps large pharma organizations make sound decisions and create a competitive advantage over smaller companies.
Conclusion: How To Win With Analytics
Given the new regulations, increasing competition, and impending shrinking profit margins that pharma organizations are facing, a powerful tool like analytics is essential to future profitability. Below are three concrete steps all pharma organizations can take toward making analytics a reality:
- Identify and prioritize the goals and requirements of analytics - Successful companies must identify and prioritize areas where they will deploy analytics tools and methods. These decisions should be based on the expected positive business impact (revenue, profitability, cash flow) and structural factors (regulation, managed care market dynamics, competition, supply and demand dynamics). This step ensures analytics will be implemented in an effective, timely, and cost-effective fashion. It also helps all those involved understand the usefulness of these new robust data collection, transformation and integration strategies.
- Prepare an infrastructure to implement analytics - Successful implementation of analytics requires thorough planning. Companies should first undergo diagnostics (internal/external benchmarking) to assess the capability and maturity of their current analytics operating model (if any). From there, they should (based on the goals set in the first step) identify gaps and create a strategic roadmap for business value creation. This involves finding key people by either developing talent internally or hiring externally; acquiring key technologies; and developing key processes for collection, integration, processing, visualization and use. In all of these decisions, companies must decide whether they want to handle this in-house, or whether they want to hire a third-party skilled at handling these
- Link analytics to business processes and measure their effect - Once analytics is implemented, companies must ensure they are being actively used. Embedding analytics into the decision making process via ePI and aligning it to business outcomes is an effective way to do this. Also important is measuring the effects of analytics initiatives to ensure that they remain cost-effective and beneficial.
The future of pharma is full of exciting opportunities and potential pitfalls, but analytics is a useful tool that can help circumvent some of the present and emerging challenges. It can seem like a daunting road to its implementation, but given the state of the industry, the way forward
is clear.
Survey Methodology
As an input to this study, WNS DecisionPoint™ conducted a survey to understand the use of analytics in the pharma industry. The respondents were categorized into
three groups: $500 million to $2 billion, $2 billion to $5 billion and $5 billion and above. Moreover, the survey was mainly targeted to reach VPs and Heads of Sales
and Marketing and other commercial functions of these companies having reasonable knowledge on associated drivers and applications of analytics.
References:
i. News by PMLive, Patent cliff losses set to cost pharma $65bn by 2019, 2014
ii. Mandate by Japanese Ministry of Health, Labour and Welfare, ROADMAP FOR FURTHER PROMOTION OF GENERIC MEDICINE USE, 2013
iii. Annual Report by Sun Pharmaceutical, Growth is a Constant, 2014
iv. Report by IMS Institute, Riding the information technology wave in life sciences, 2014
v. Novel Drug Summary by FDA, 2016
vi. McKinsey Report, Beyond the Storm - Launch excellence in the new normal, 2013
vii. News by Forbes, Pfizers-projected-3b-drug-name- will-shock-you, 2013
viii. Deals Publication from PwC, US health services deals insights, 2015
ix. News by FierceBiotech, Biopharma posts a chart- topping 41 new drug approvals in 2014, 2015
x. Access Monitor Report by ZS Associates, If Physicians aren't listening to Sales Reps, What are they listening to, 2014
xi. News by GlobeNewswire, CEGEDIM STRATEGIC DATA: Worldwide Pharma Industry Sales Force Levels Flat in 2014, 2015
xii. Survey by Quantia, 2013
xiii. Article by Pharmaphorum, How to drive commercial excellence through analytics: lessons from two leading pharmacos, 2015
Acknowledgments:
a) Report by McKinsey, Beyond the Storm - Launch excellence in the new normal, 2013
b) Report by IMS Institute, Riding the information technology wave in life sciences, 2014
c) Report by BCG, Essentials for Pharma Key Account Management - Partnering for Value, 2013
d) Report by McKinsey, Value-driven drug development
- unlocking the value of your pipeline, 2011
e) Report by Everest Group, Analytics in Pharma and Life Science, 2014
f) Report by Bain, A new pharma launch paradigm: From one size fits all to a tailored product approach, 2013
g) Report by Mizuho Bank, Restructuring the Pharmaceutical Industry, 2014
h) Annual Reports and Filings of Top Pharmaceutical Companies